Dashboards
QASS Dashboards
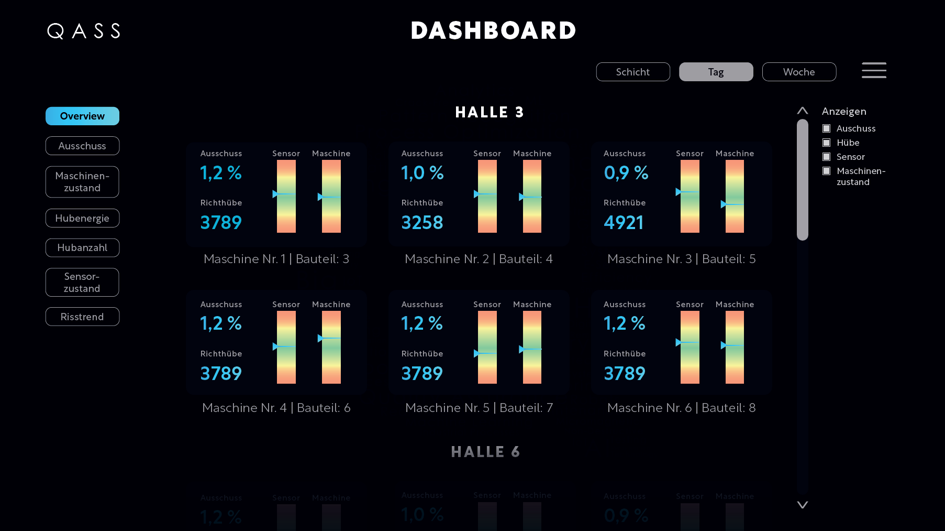
Everything at a glance with our QASS dashboards:
Our dashboards provide a comprehensive overview of all measuring systems in your network. Whether networked locally or via WLAN, you can access your systems conveniently from the office via a web browser. All important production information is available at a glance so that maintenance and support can be carried out quickly and efficiently. This centralized control and monitoring saves you time and resources while giving you full control over your measurement processes.
- Overview of all measuring systems
- Reach your measurement systems from the office via web browser
- All important information about the production at a glance
- Enables better support and faster maintenance of the system
Individual user interfaces
QASS Pen-GUI
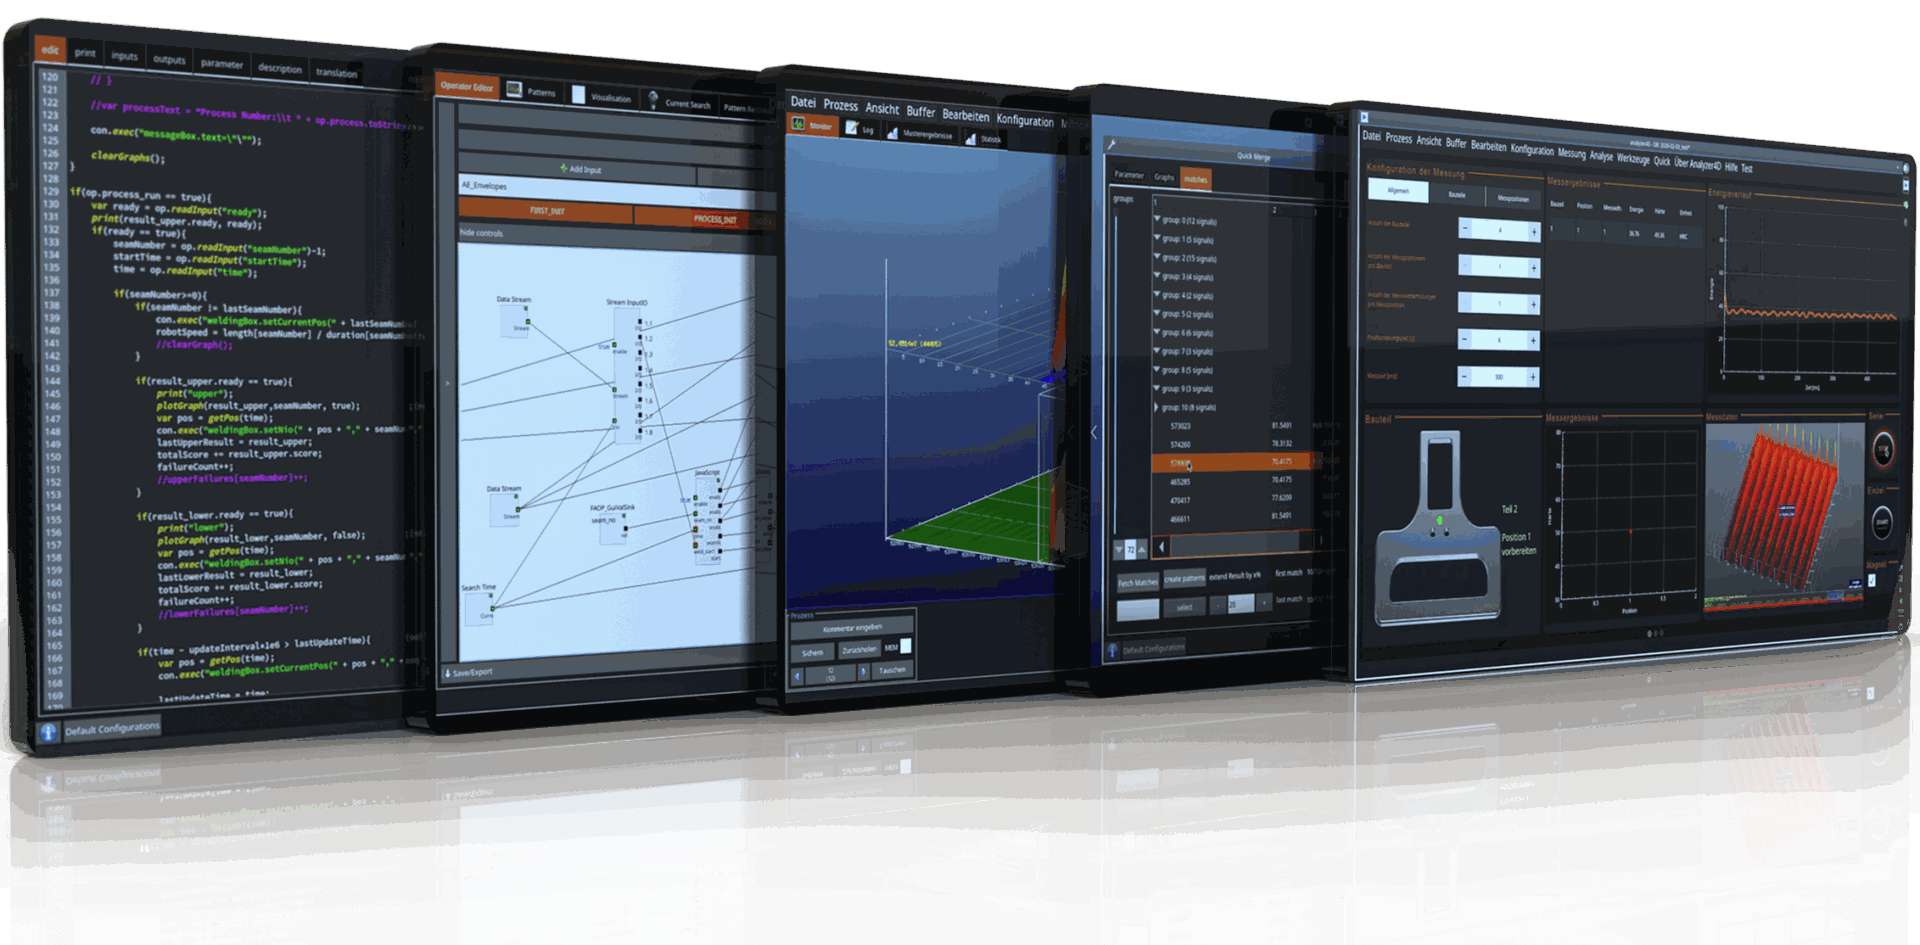
User interface completely customized to your needs
With our pen GUI, we design user interfaces that are fully tailored to the customer's requirements. Various visualization options, such as shift counters, traffic light systems or tachometers, enable the most important production data to be displayed in a targeted manner. The focus is always on the crucial information - what data is required, how and when should it be displayed? With multiple access levels and interactive elements to control the measurement, we offer a flexible and user-friendly solution that is specially developed for your processes.
- Various options for data visualization such as shift counter, traffic light, tachometer, etc.
- Focus on the essentials - What data? How? Where? When?
- Multiple access levels
Clustering
Pattern clustering in the Optimizer4D
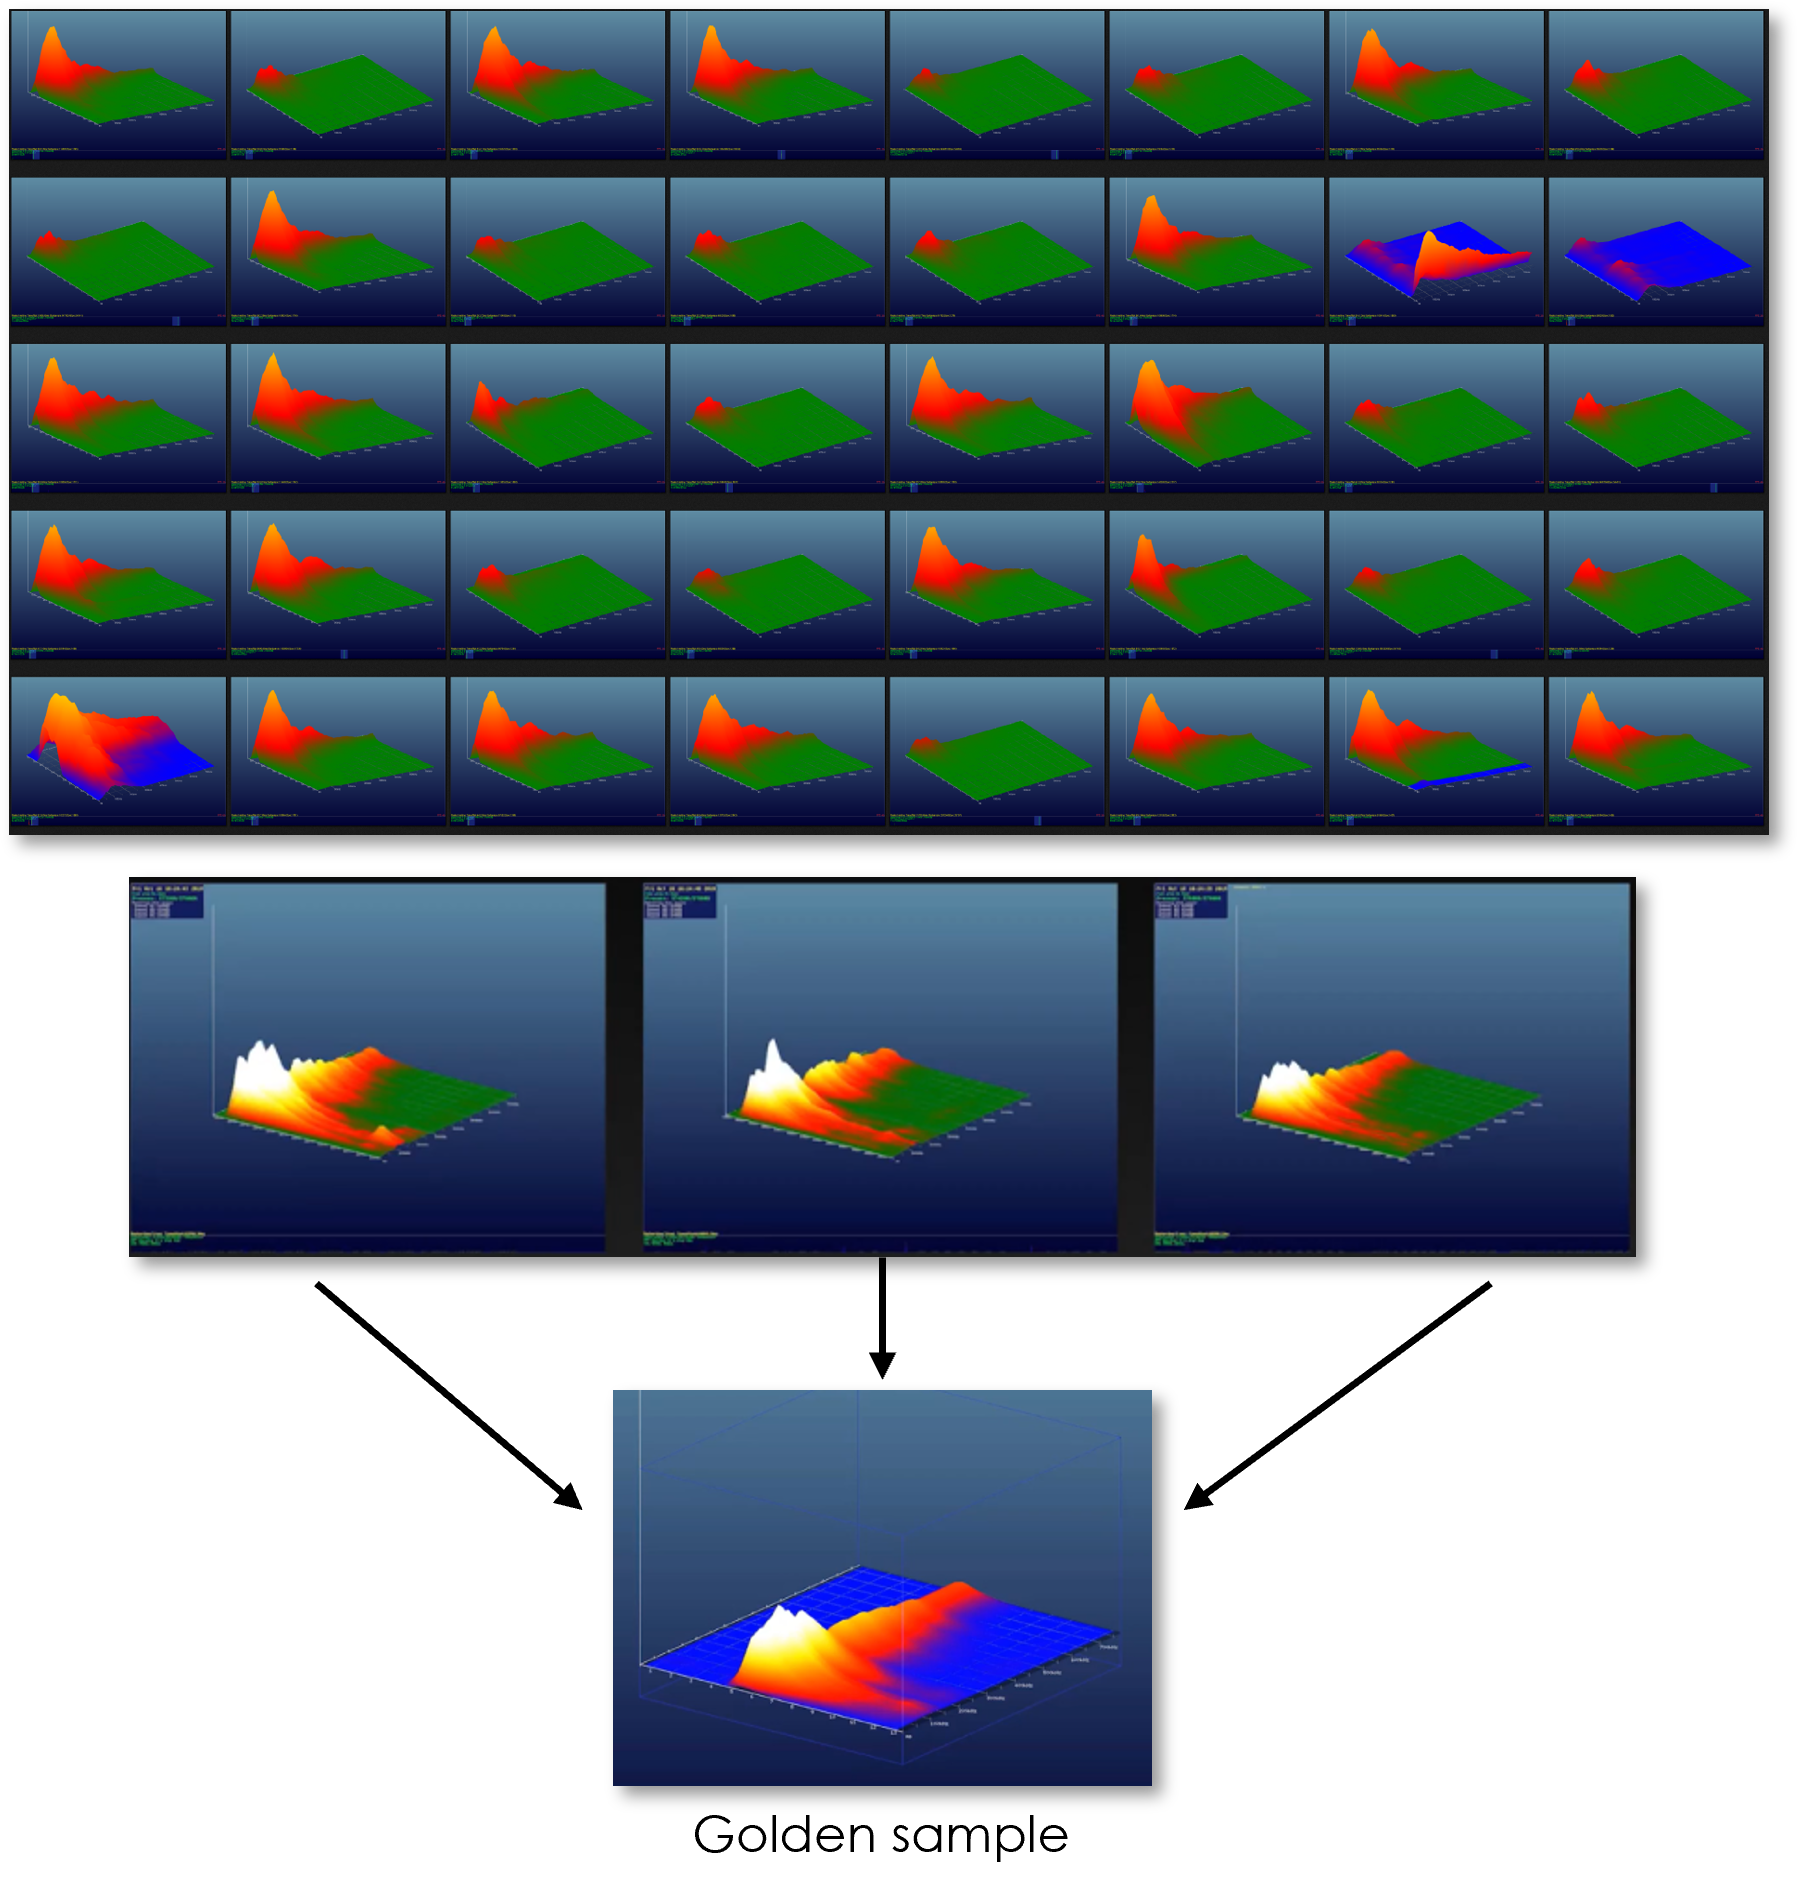
QASS Clustering:
The automatic grouping and clustering of recognized patterns is a central component of our software. Based on similarities in frequency, amplitude and duration, the signals are automatically divided into clusters such as “cracks”, “noise” and other groups. Within the same clusters, signals are offset against each other, resulting in a basic pattern - the so-called “golden sample”. This represents the typical behavior of a particular signal type and serves as a reference for future detections. In this way, we ensure precise and consistent pattern recognition, which is continuously optimized.
- Detected patterns are automatically clustered and grouped based on their similarity
- The different clusters are divided into "cracks", "noise" and other signal groups
- Clusters of the same signal type are calculated with each other and result in a base pattern (golden sample)
Scripting
Programmable evaluation modules with Python

Maximum adaptivity through Python scripting
Maximum flexibility in data analysis is achieved through the integration of Python scripting. The Python operator is an independent analysis module within the operator network and allows users to implement their own algorithms. This allows users to access the data stream directly in real time and perform analyses without being restricted to predefined functions. This opens up numerous possibilities, such as the use of data science libraries, the integration of machine learning algorithms and the creation of individual modules. Our solution is open to the end user and offers an ideal platform for developing customized analyses - fully integrated into the operator network and yet independently usable.
- Enables data analysis with Python
- Enables the use of Datascience modules and libraries
- Integration of machine learning algorithms
- Open for the end user
- Allows you to write your own modules
Operator network
Graphical measurement programming
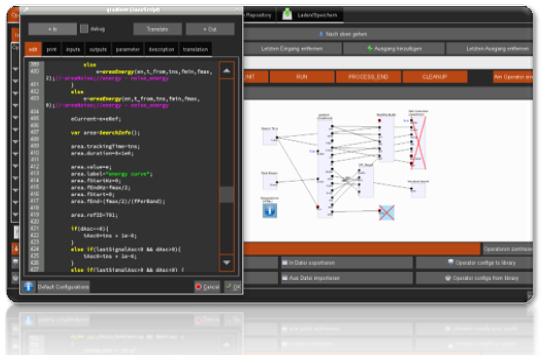
The QASS Operator Model
- Optical scripting of the evaluation modules
- Evaluation modules can be interconnected as required
- Scripting modules enable specially adapted analysis algorithms in Python
- Graphical measurement programming
The operator network allows analysis sequences to be designed modularly and flexibly using optical scripting. As in “node-based” programming, the individual analysis modules can be graphically interconnected so that complex analysis processes run automatically via triggers or time controls. Each module - or “operator” - represents a specific analysis step and can exchange data with other modules. A Python operator is also available, which enables the integration of user-defined analysis algorithms. The operator network makes it easy to create customized evaluations and analyses even without in-depth programming knowledge, while the Python operator provides full flexibility for experts.
Pattern recognition
Recognition of patterns in the Analyzer4D software
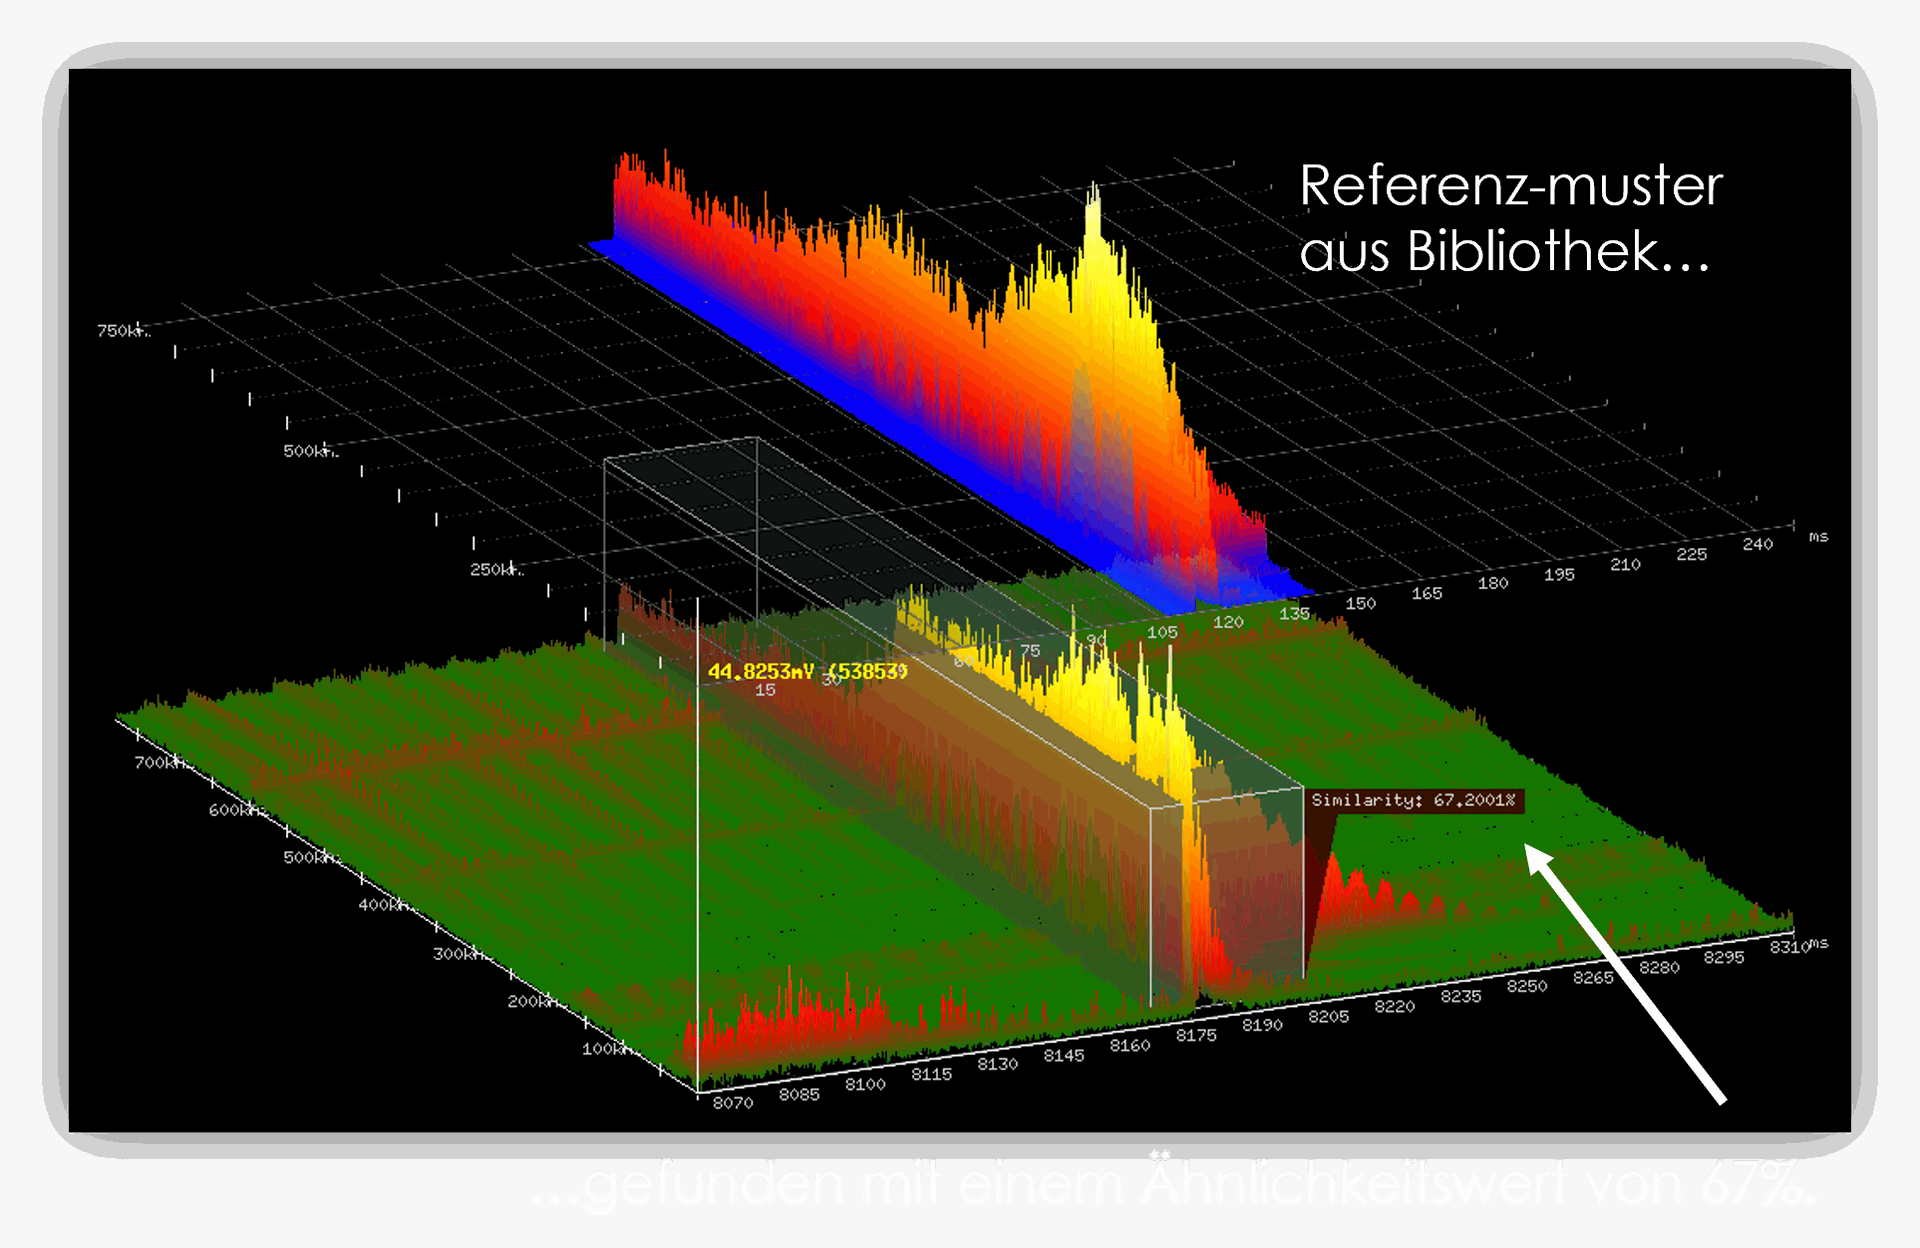
Advanced pattern recognition - no energy thresholds necessary
While conventional systems only react to energy thresholds and can thus generate pseudo rejects, our pattern recognition goes one step further. The shape of the signals is decisive, not just the energy content. Thanks to an extensive library, which is continuously expanded on the basis of real crack parts, we compare the current data stream with known reference patterns. This happens in real time, and our system can send millisecond-accurate rejects to the machine as soon as a crack is identified.
Flexibility and adaptability
Our pattern recognition is adaptable and flexible. Depending on the process requirements, the user can decide whether the entire frequency spectrum or only specific areas should be analyzed. The library can also be expanded with new patterns so that we are optimally equipped for a wide range of materials and production processes. This enables highly precise differentiation even in noisy industrial environments, where error-free detection of cracking noises is essential.
Competitive advantage: avoidance of pseudo scrap
One of the outstanding features of our pattern recognition is the drastic reduction of pseudo rejects. By accurately distinguishing between real crack noises and environmental disturbances, we avoid unnecessary process interruptions and ensure smooth production. This offers a decisive competitive advantage, especially in highly automated production environments where speed and precision must go hand in hand.
Noise suppression
Noise suppression and filtering
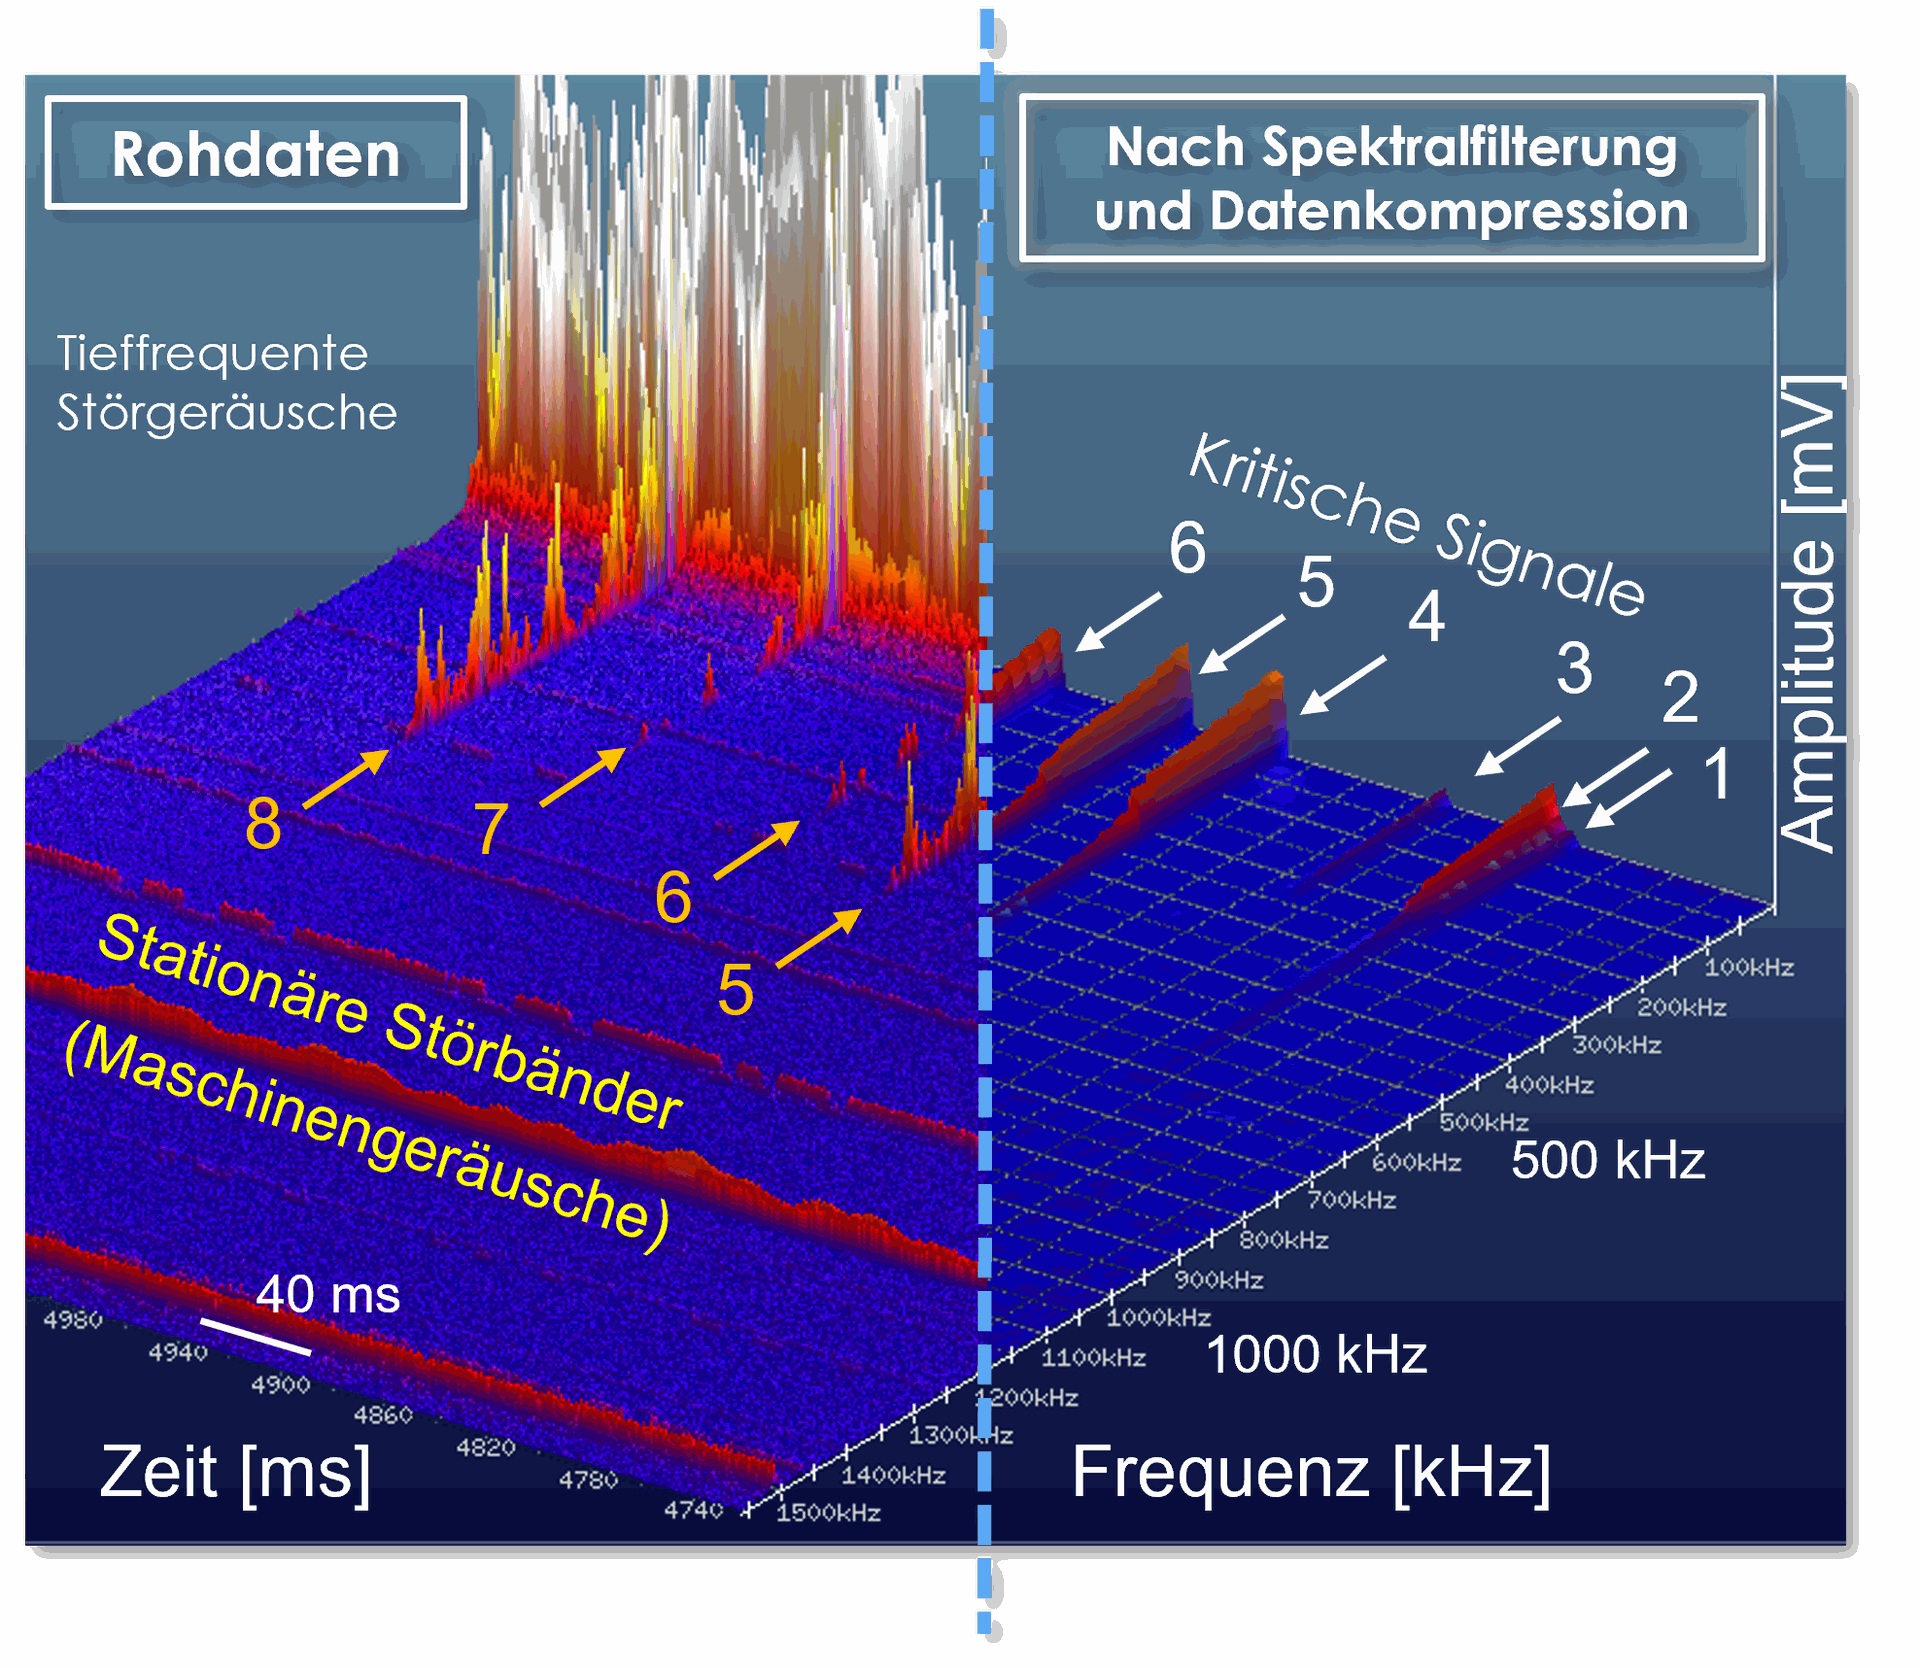
Our software contains powerful pre-processing of the measurement data, which makes it possible to efficiently suppress background noise. While the raw signal is still available in a two-dimensional format (time and amplitude), a three-dimensional FFT signal is generated by applying spectral analysis. This signal can then be specifically freed from machine noise and other interference using spectral filters. The filtering is based on the process image and is specially adapted to your process during installation. Compression of the data to the essential content ensures that only relevant information is taken into account for analysis and evaluation.
Preprocessing of the measurement data
- Noise suppression by means of spectral filtering
- Compression of the data to the essential content
3D Spectral analysis
3D process landscape (spectrogram)


Our 3D spectral analysis expands the classic measurement data representation from the usual 2D representation (time and amplitude) to a three-dimensional model that additionally integrates the frequency axis. This enables significantly improved signal detection, as we can analyze processes across time, frequency, and amplitude. Noise, such as low-frequency machine noise, often masks higher frequency ranges where crucial signals, such as crack or working noises, occur.
