GUI
Customizable user interfaces for maximum data transparency and acceptance
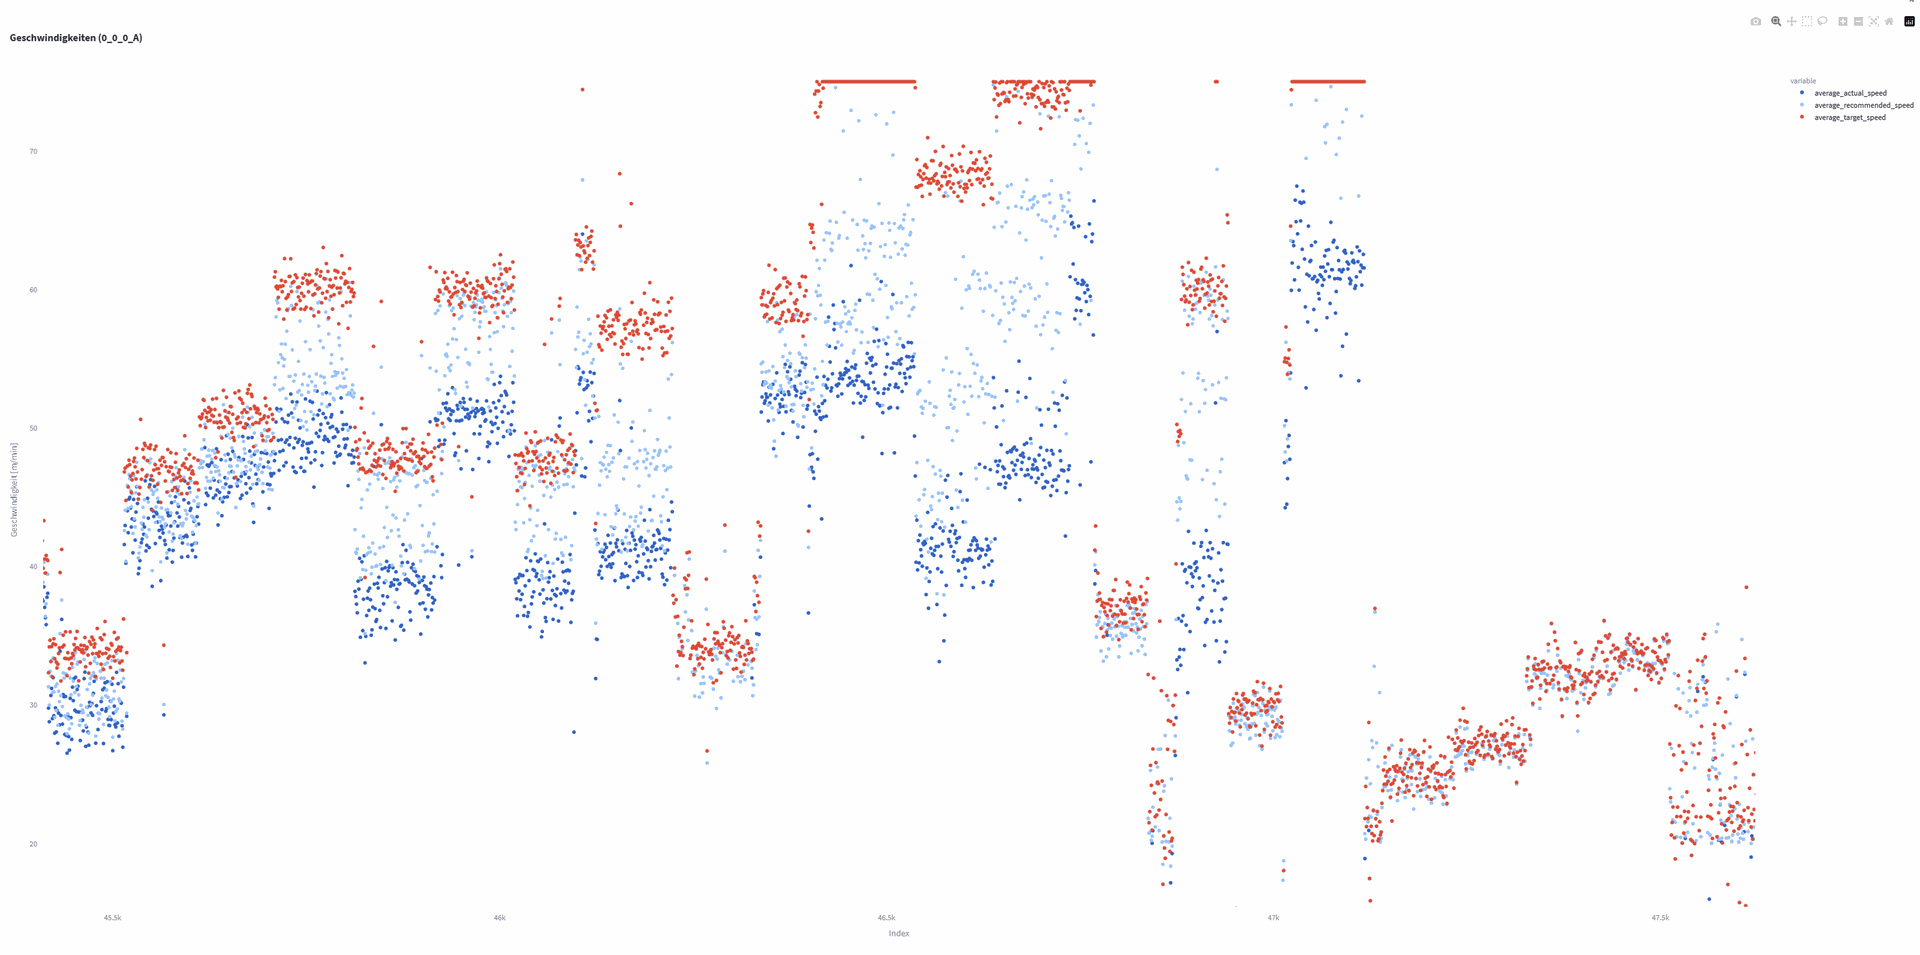
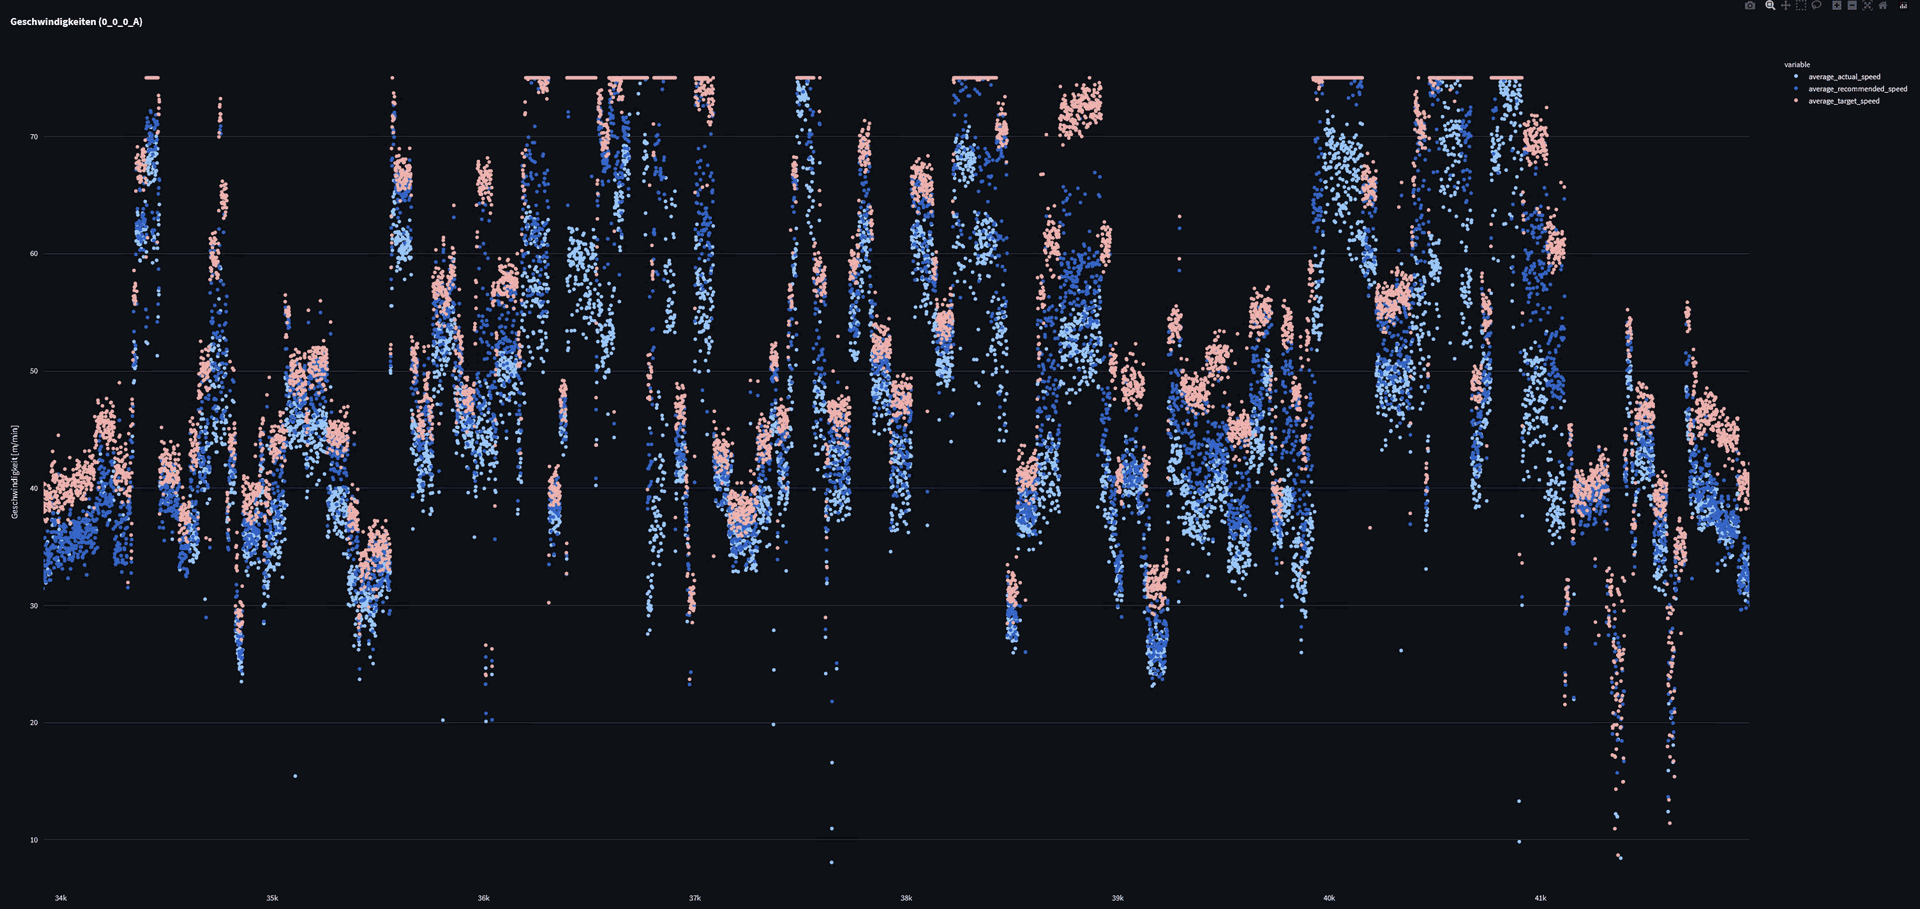
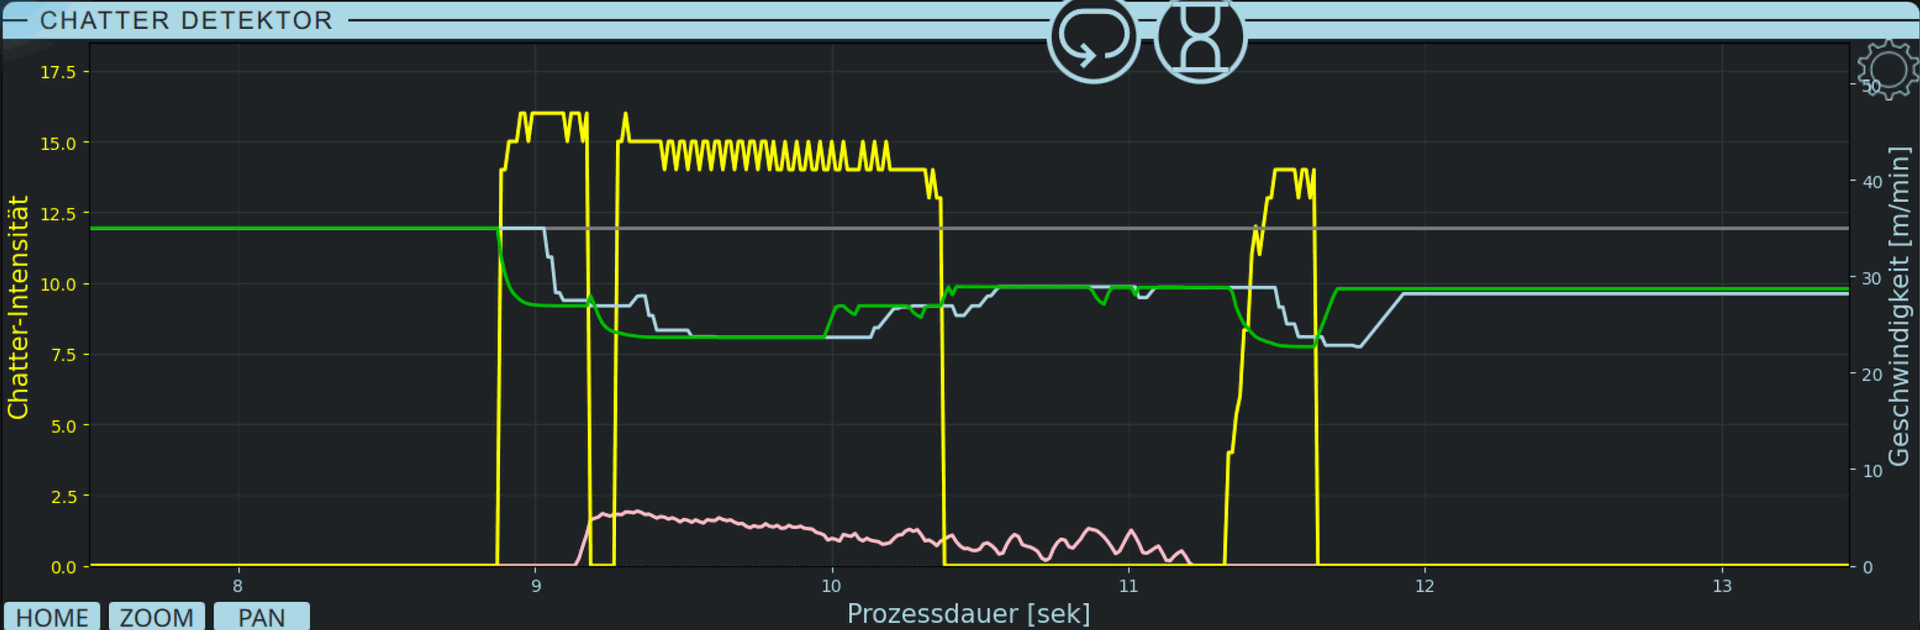
The presentation of complex or extensive measurement data is of crucial importance in order to promote process comprehensibility and increase the acceptance of a measurement system. At QASS, we specifically focus on the customizability of user interfaces, also known as Graphic User Interfaces (GUI). Our GUIs are a key feature that allows our customers to display data in a way that suits their individual requirements.
Freely programmable user interfaces and data analysis
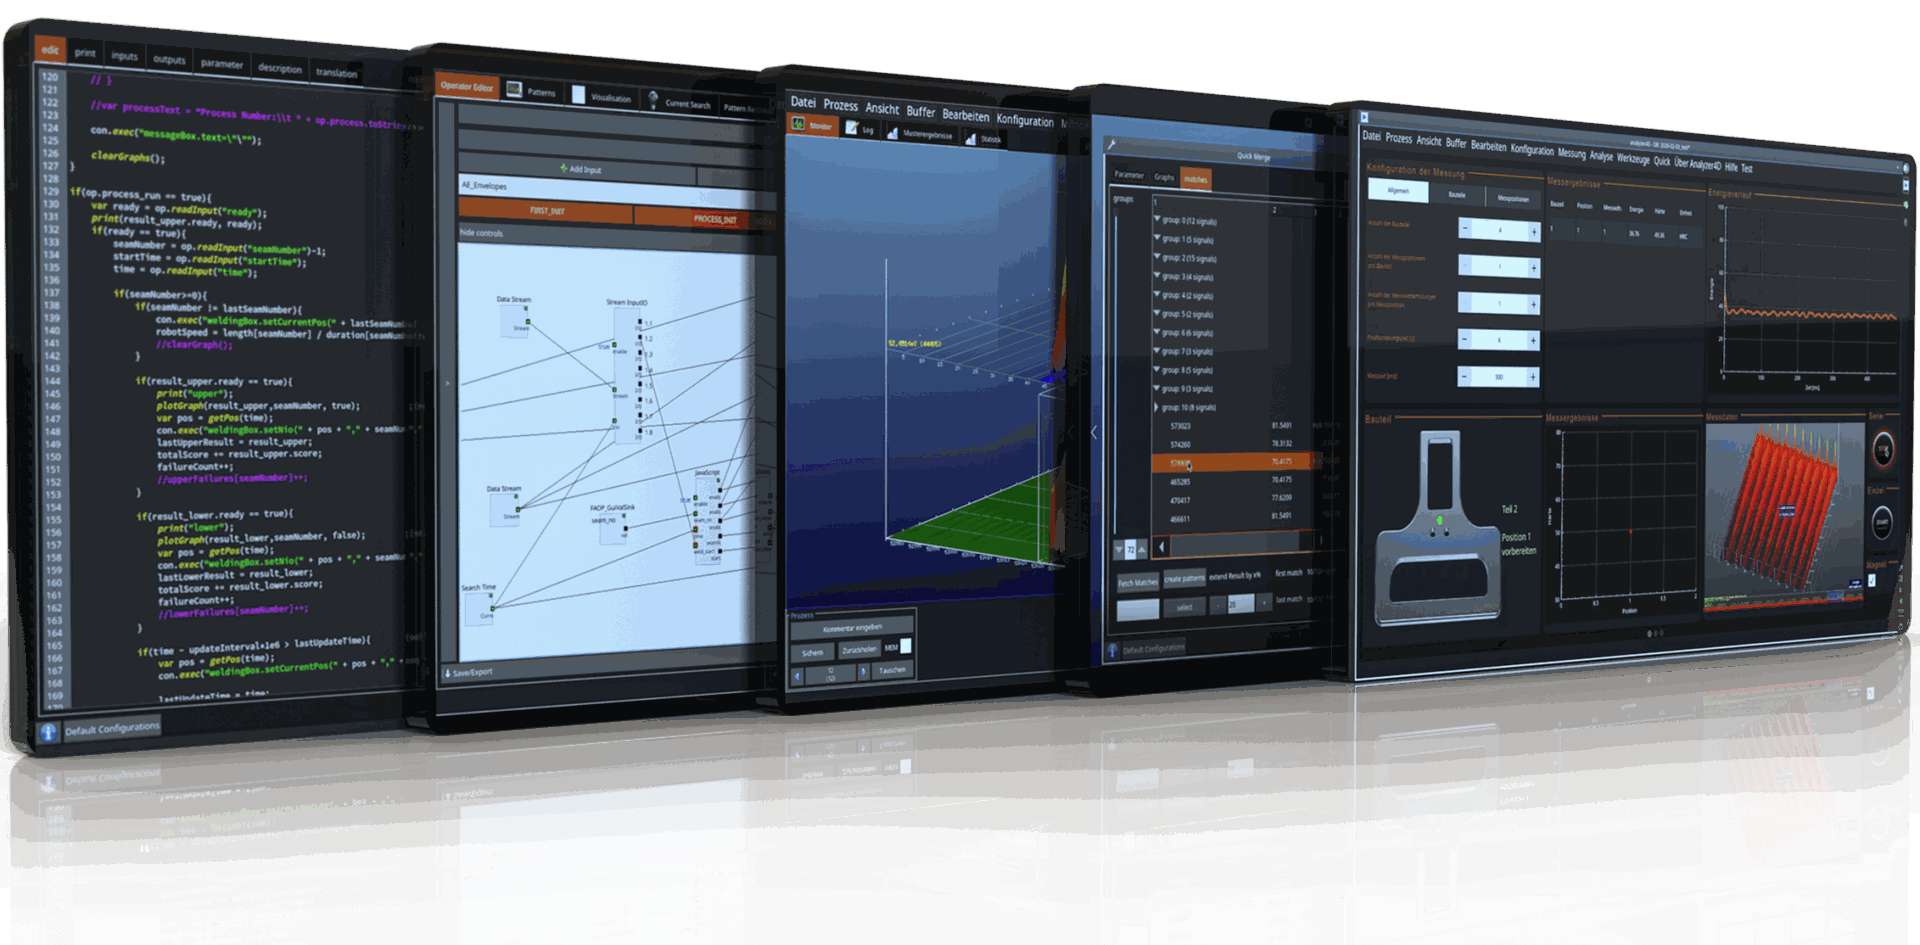
With QASS, we not only offer customizable data analyses, but also the option of programming user interfaces according to your requirements. Using the QT Modeling Language, you can display measurement data in suitable formats and at the same time take over the top level of device control. This enables a target group-oriented and highly individual design of data and settings for analysis procedures. As this is a freely programmable interface, there are practically no limits to the implementation of your requirements.
Wide range of display options via the network
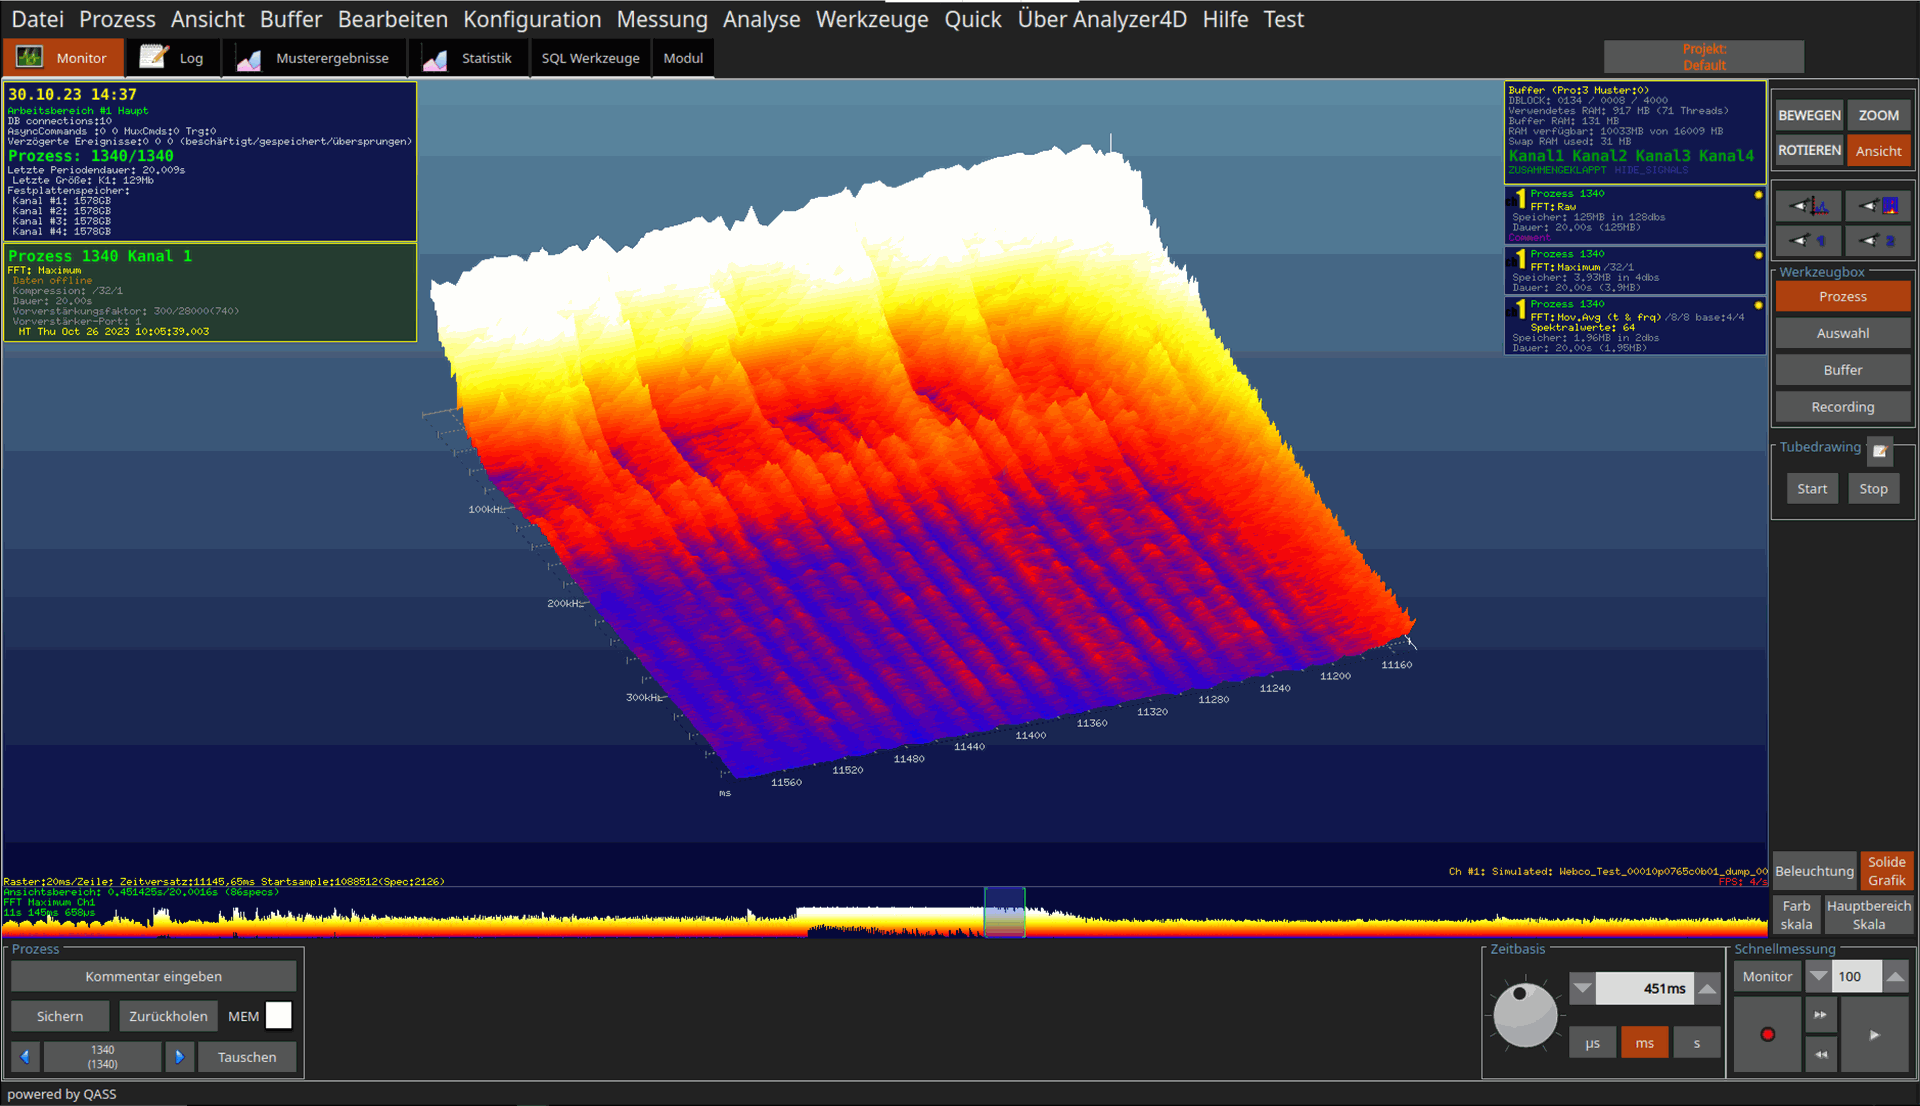
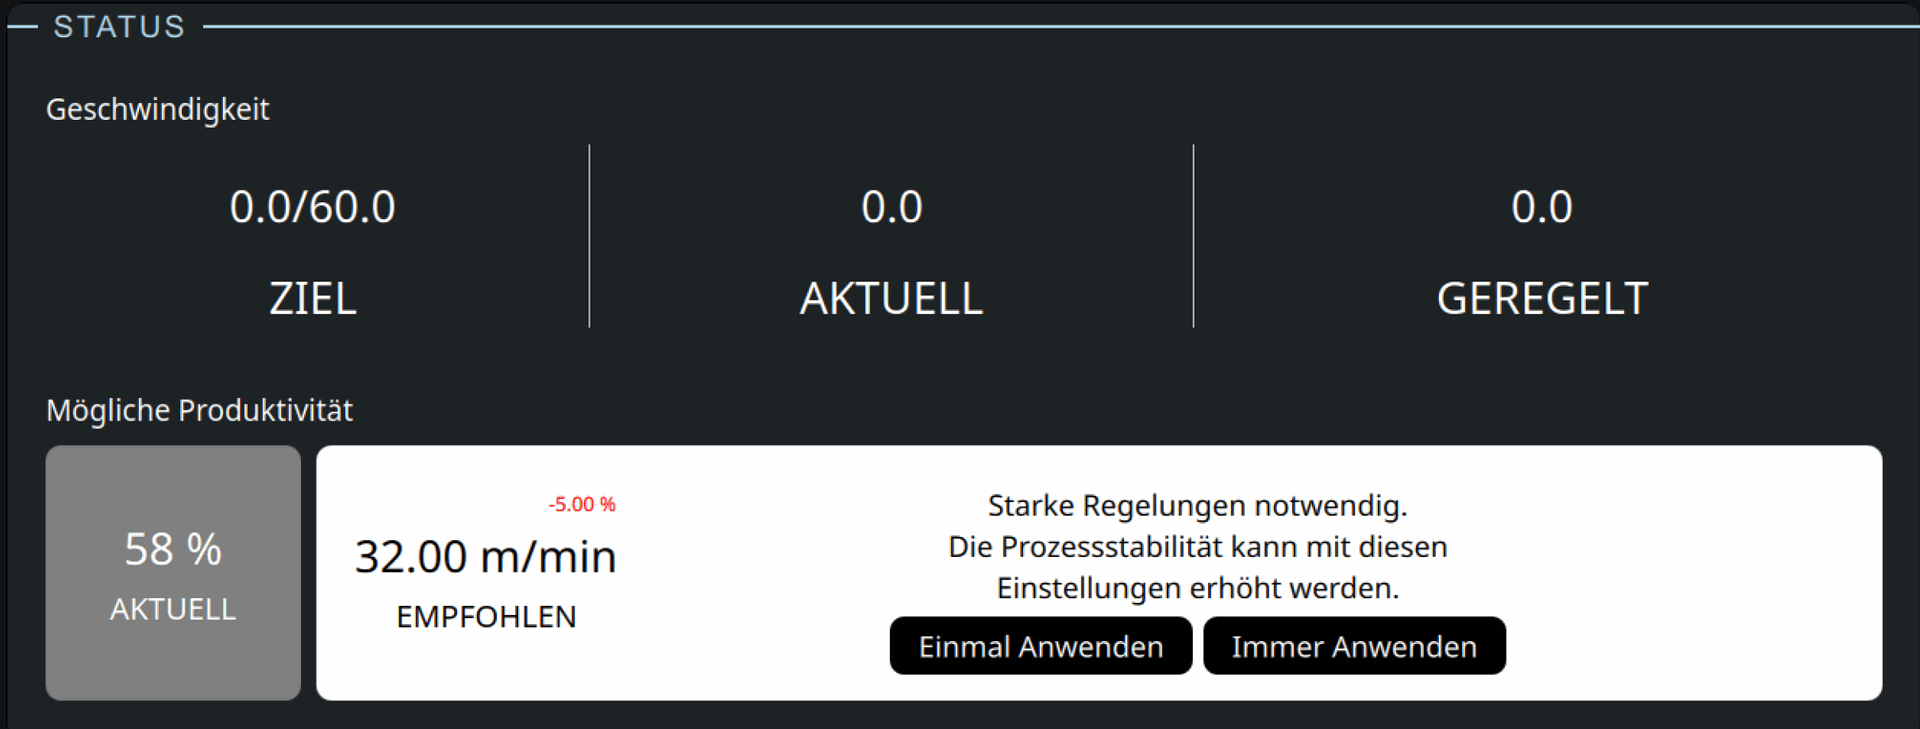
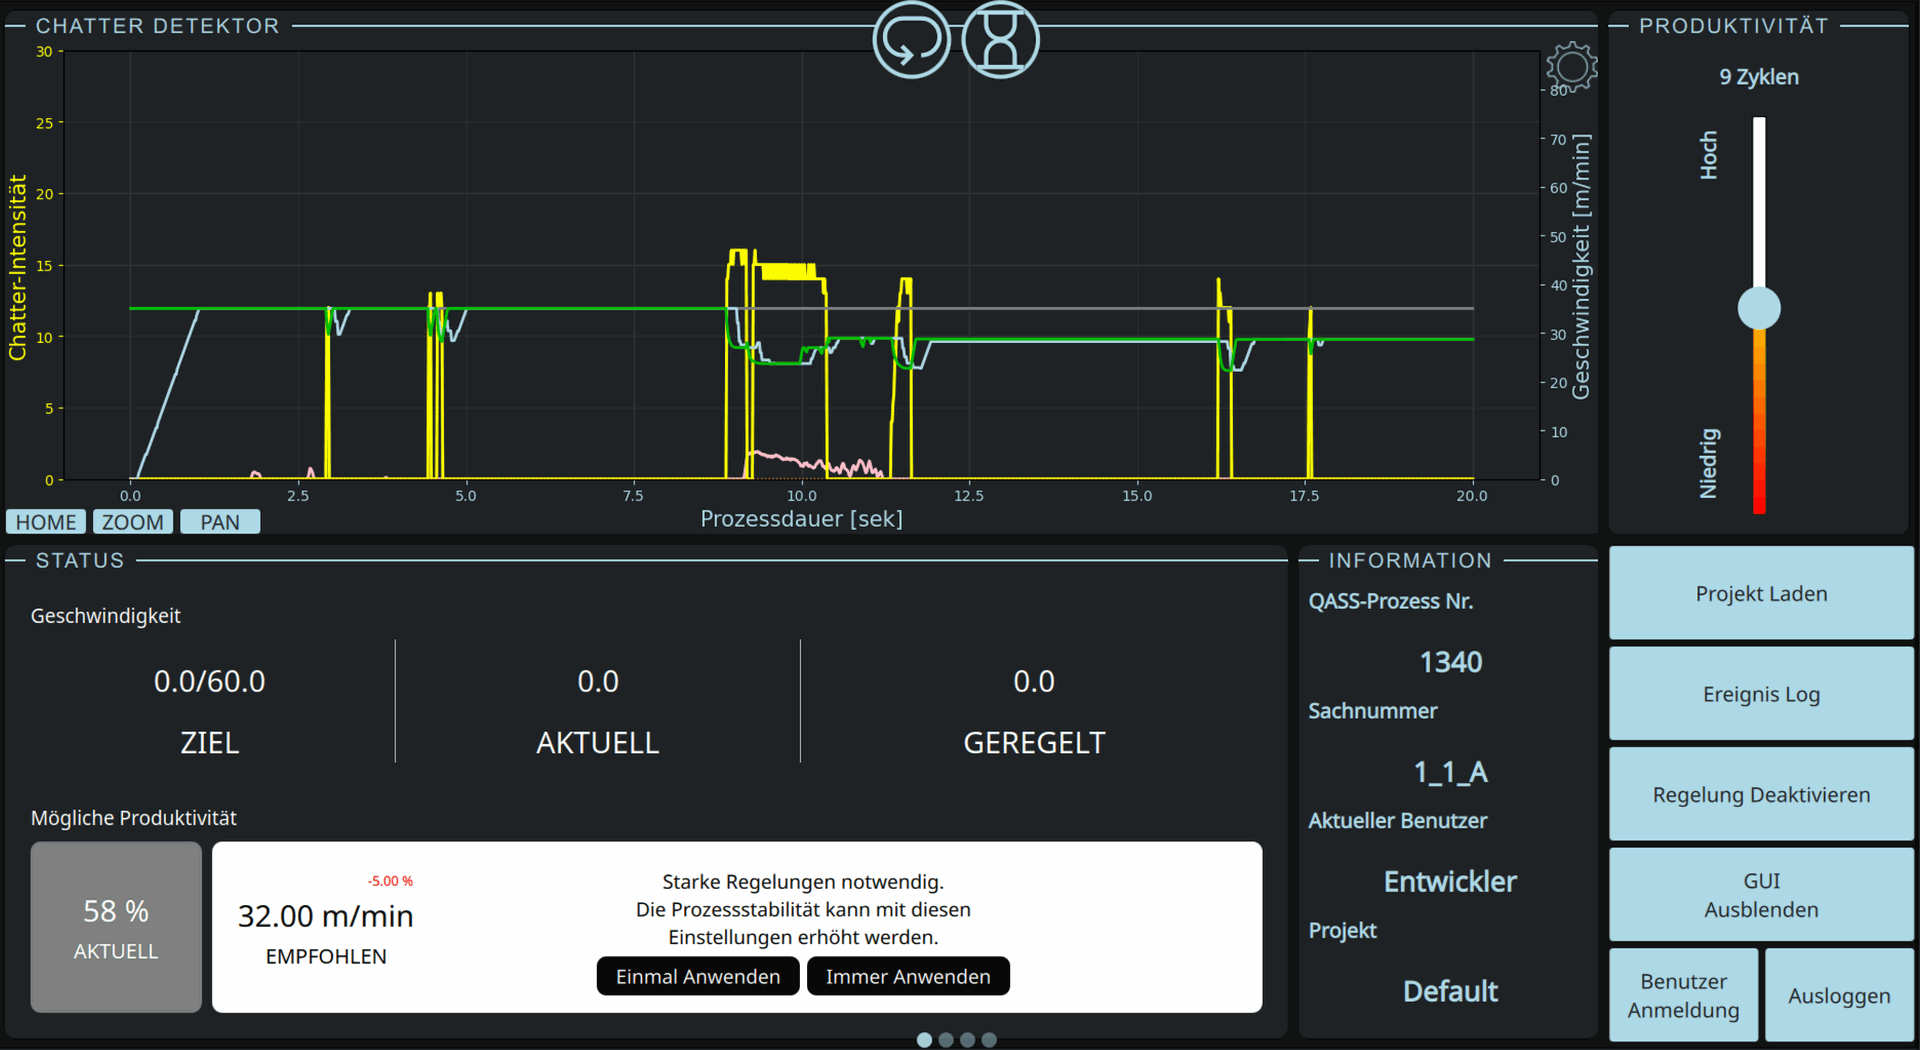
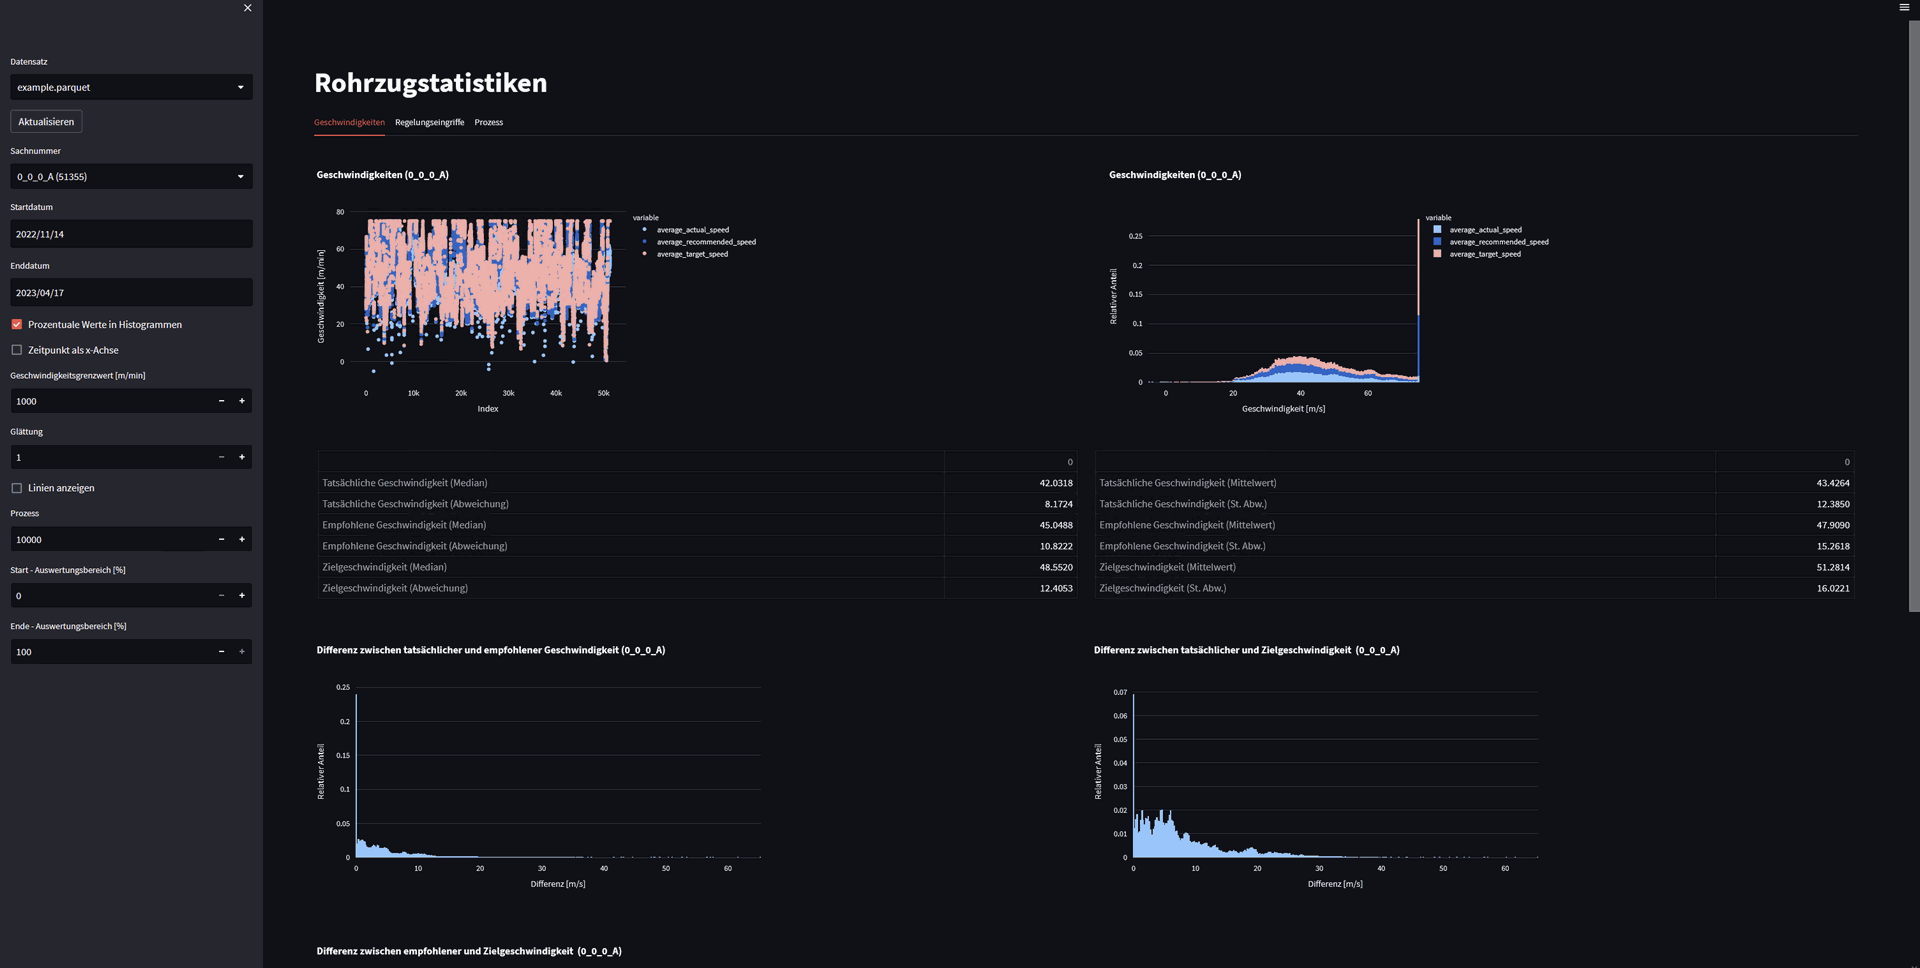
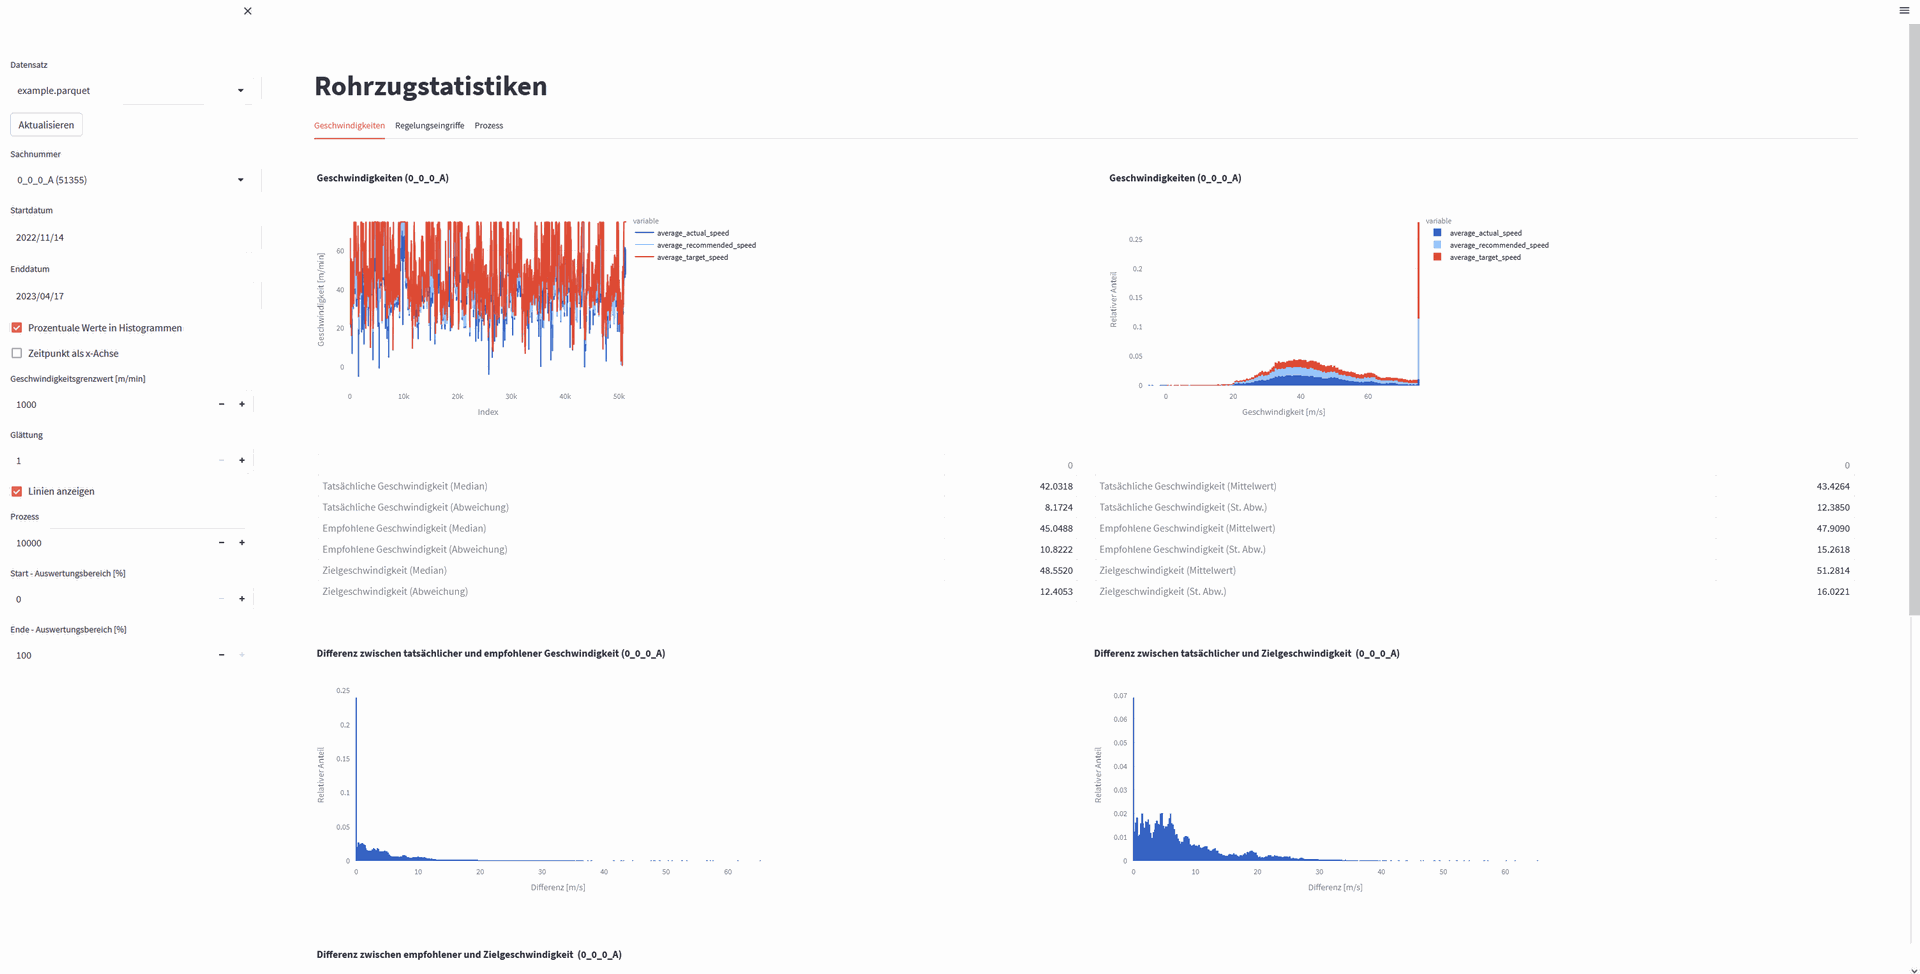
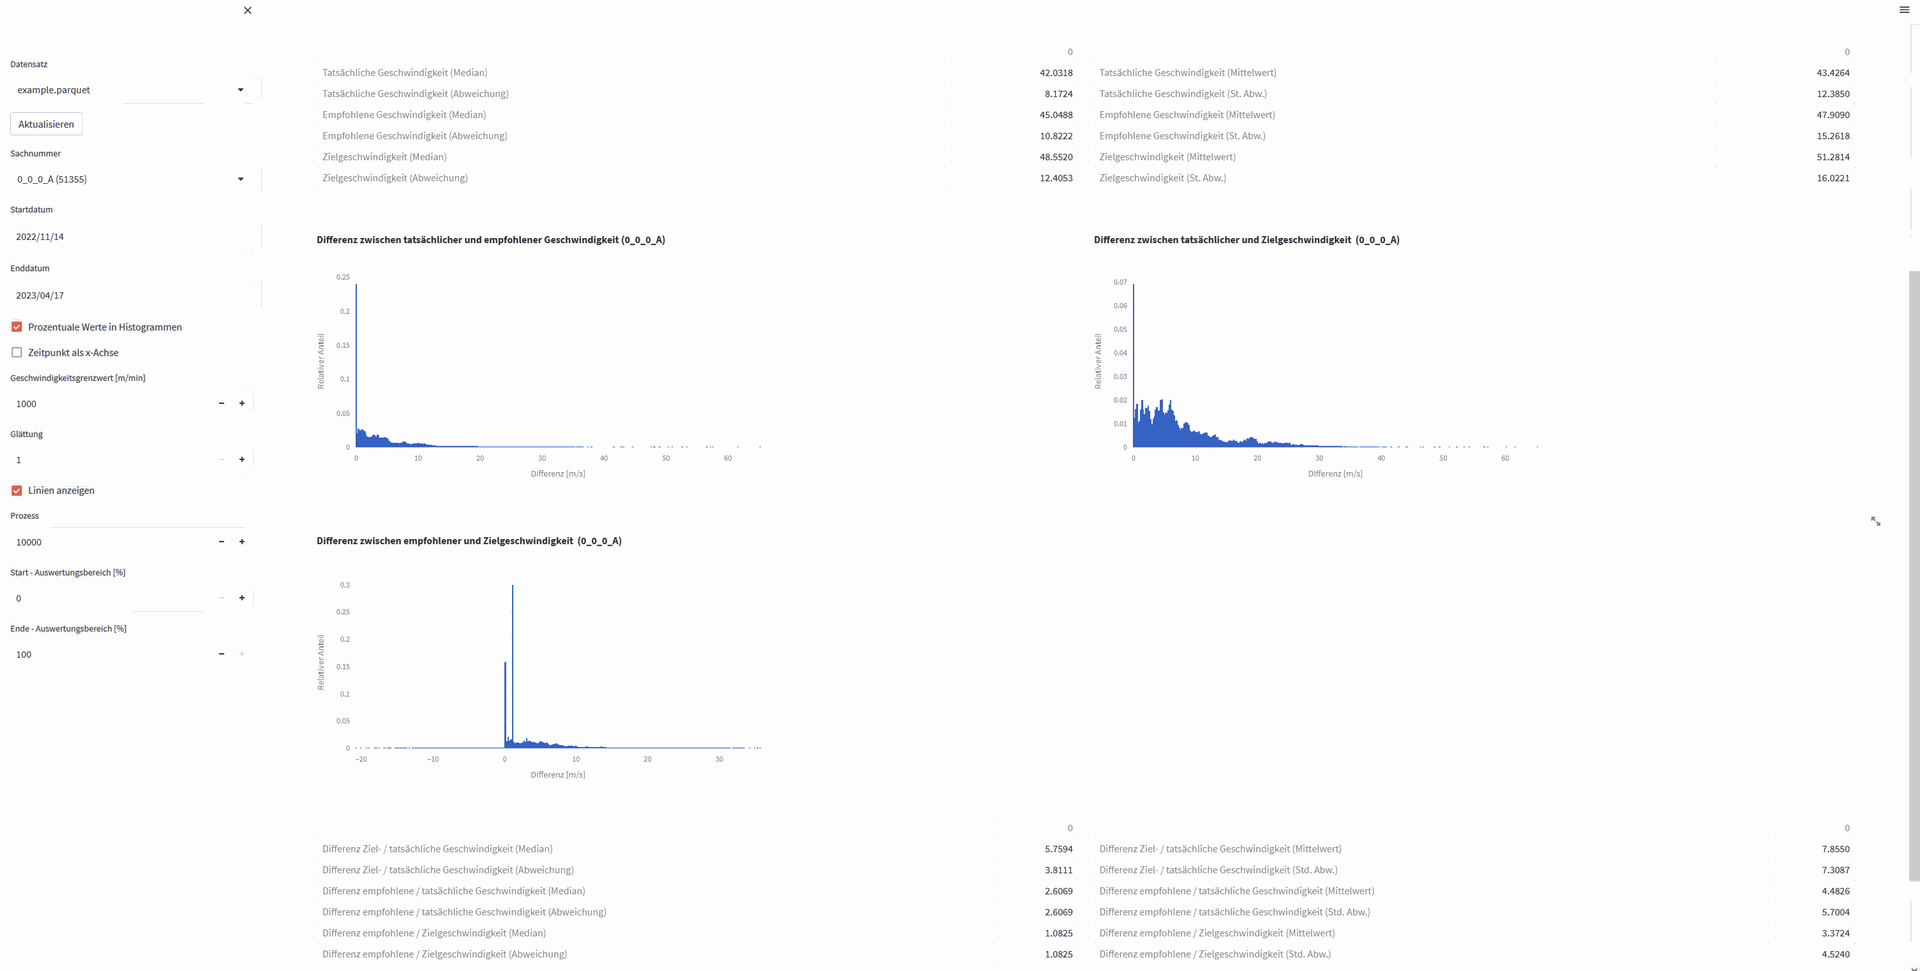
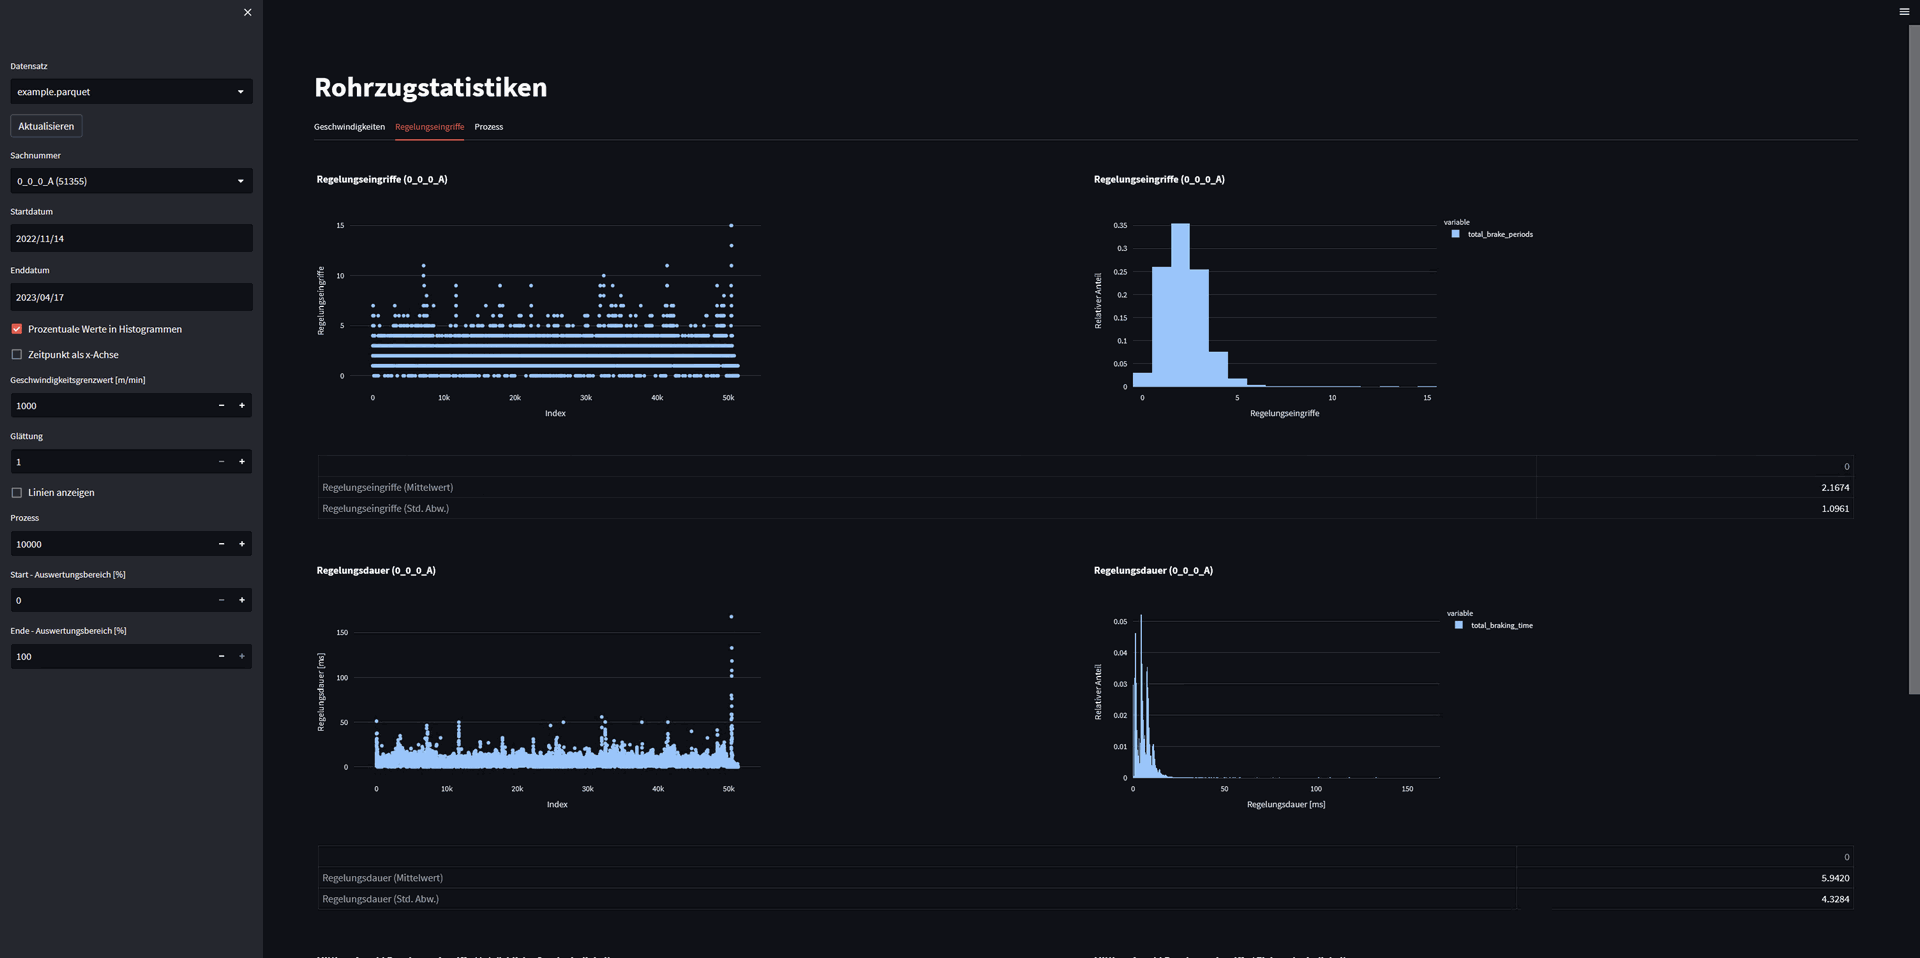
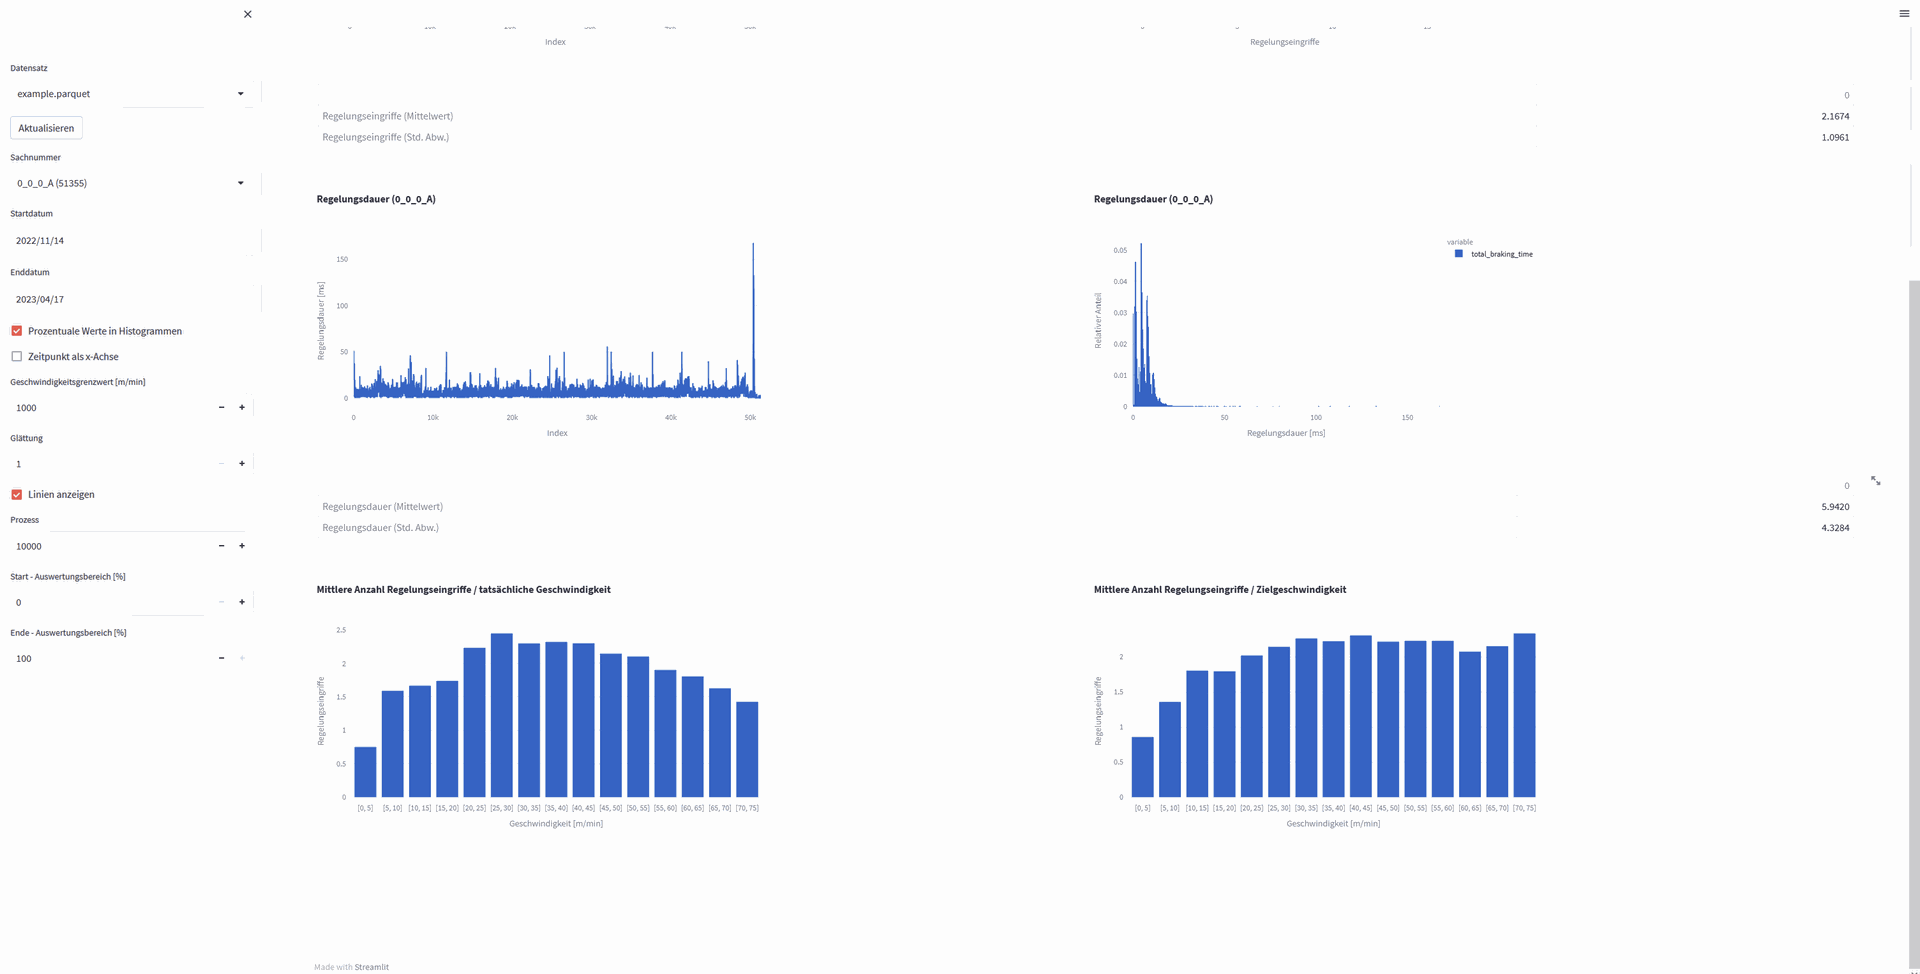
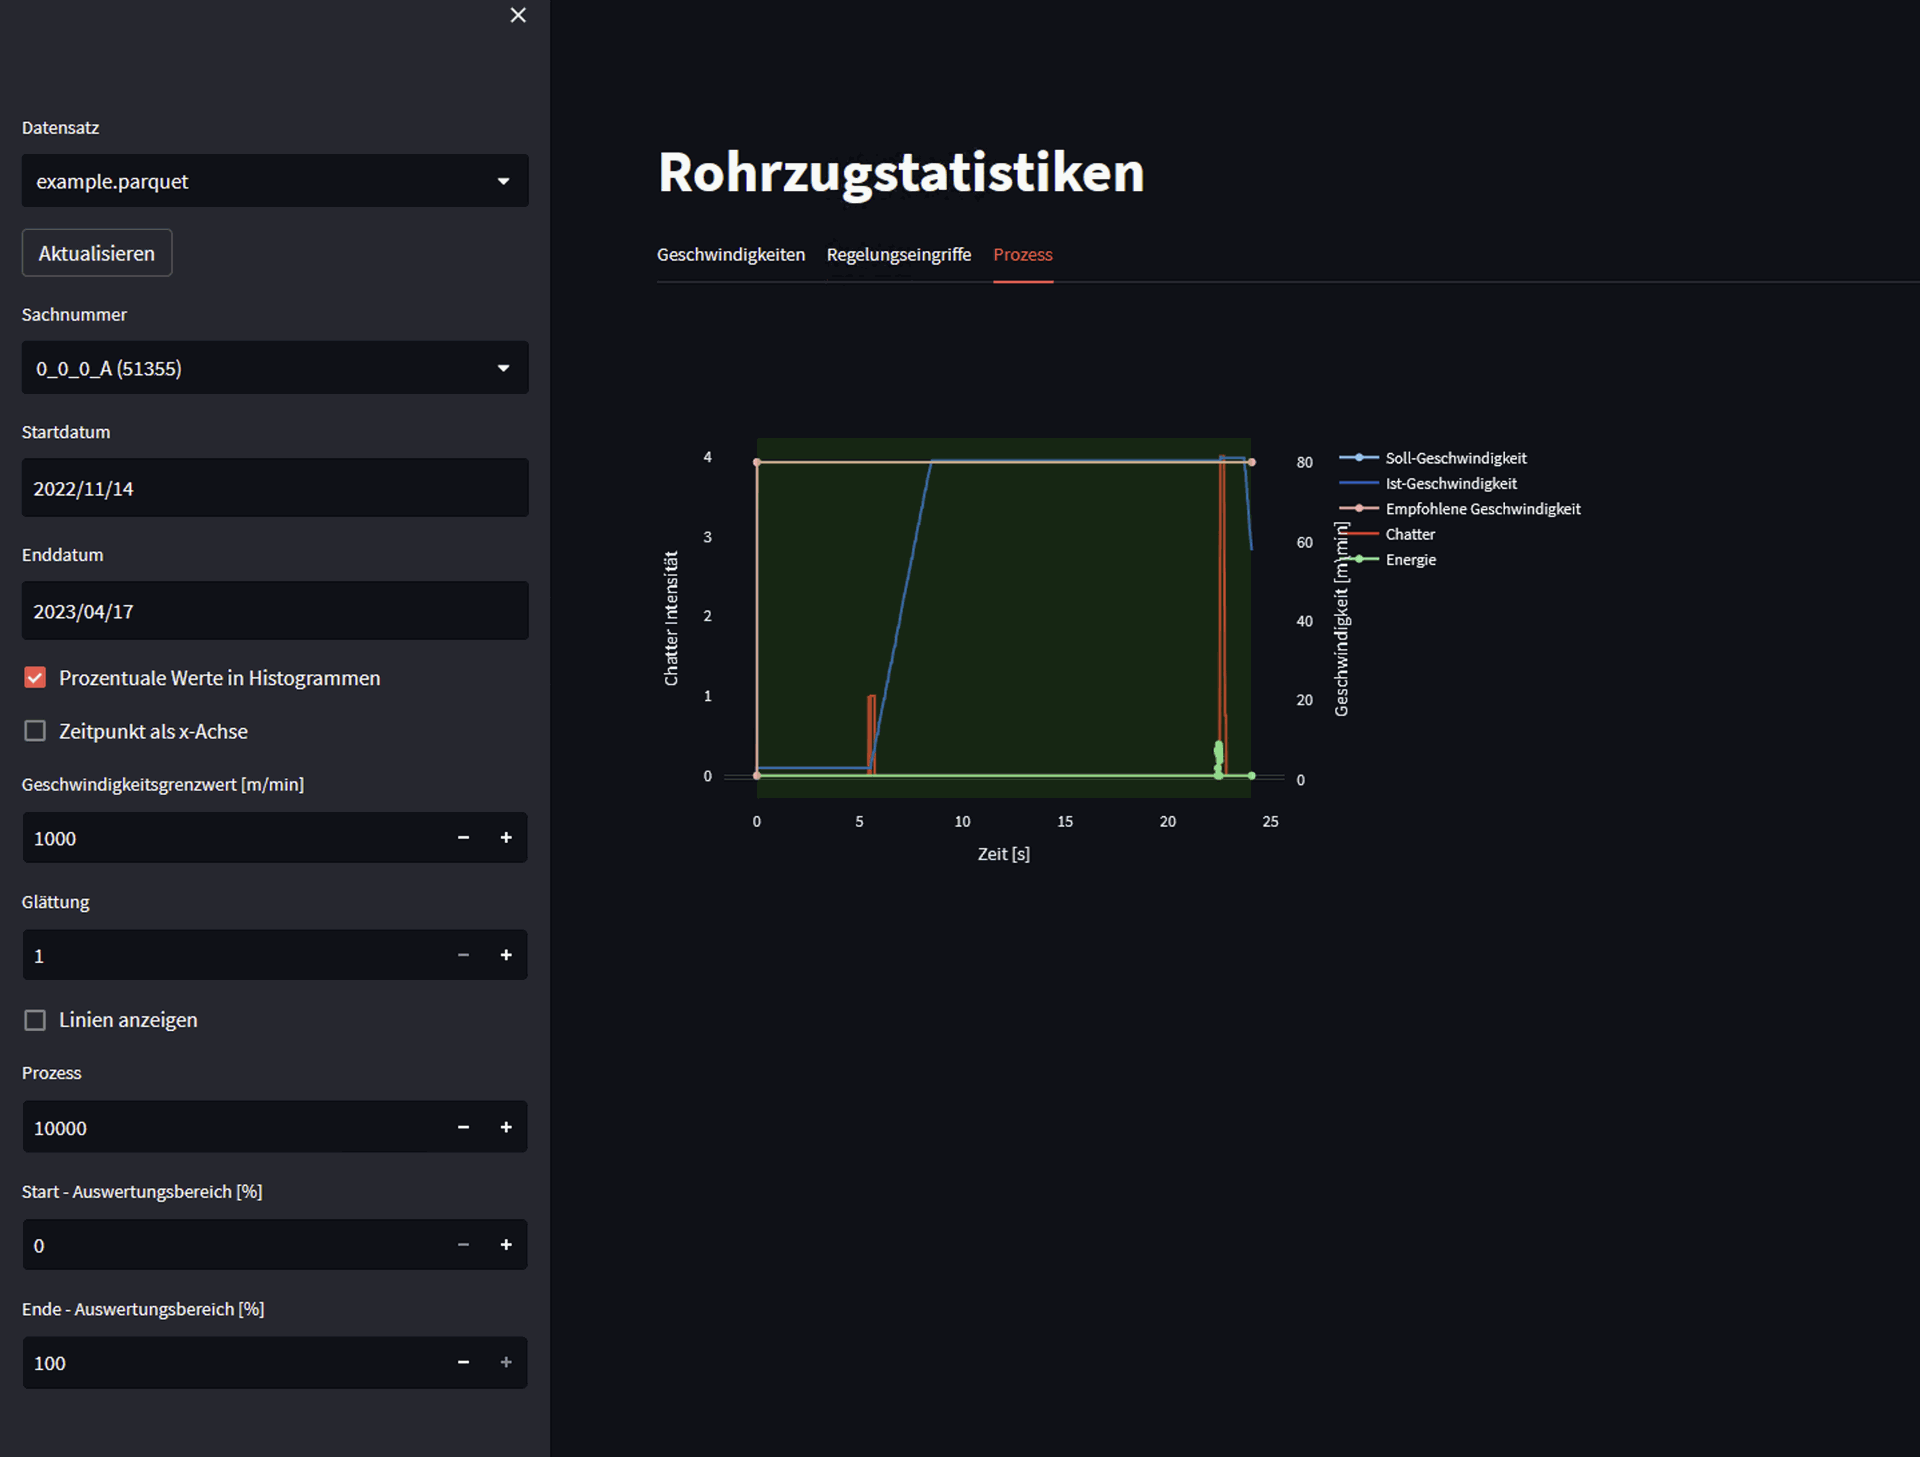
The fact that the data is freely available on the device and in the database means that you are not limited to the Analyzer4D when it comes to the choice of presentation. With libraries such as Dash or Streamlit, you can create appealing dashboards for the browser that are accessible anywhere in the network. In this case, the Optimizer4D acts as a powerful data server that several participants can query simultaneously. However, this type of presentation is not limited to Python web libraries. You can also use REST APIs or modern JavaScript frameworks such as React and Angular to prepare the data professionally.
With the customizable user interfaces and the variety of display options offered by Optimizer4D, you have all the tools you need to present and analyse measurement data in a way that meets your individual requirements and target groups. Improve the transparency of your data and increase the acceptance of your measurement system with QASS.
Contact us to learn more about how our customizable user interfaces can help you optimize your data management and data visualization.
Code examples from our pen GUI "Tube Drawing"
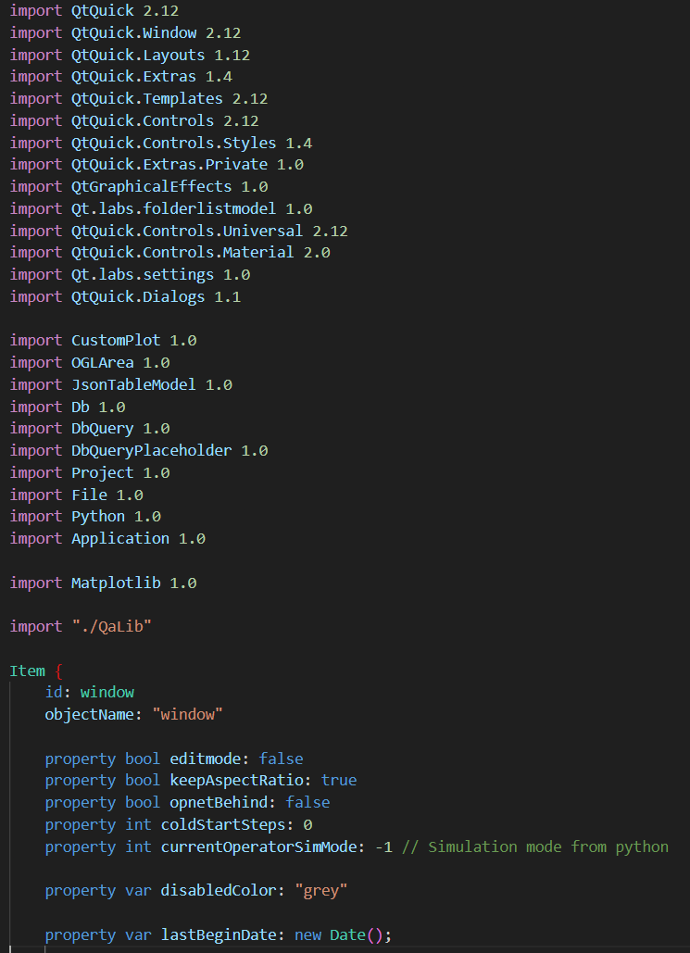
Integrating the libraries into the main GUI file
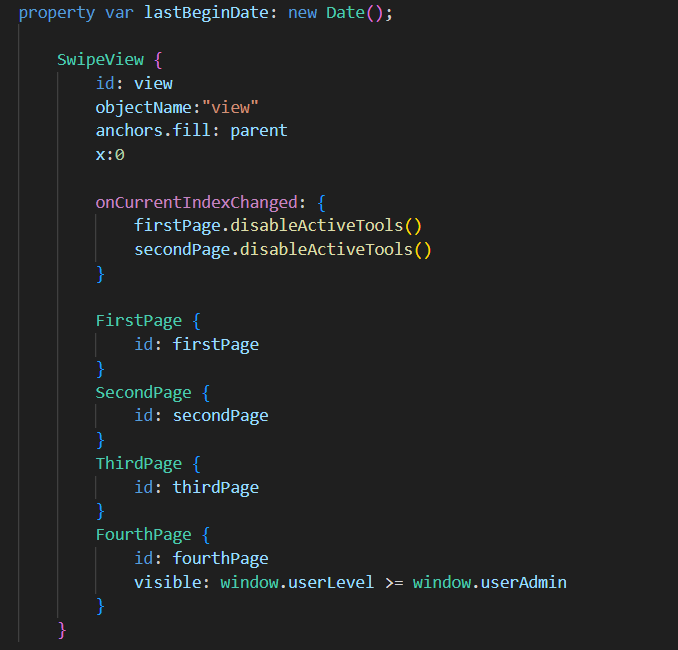
Swiper, for wiping through several GUI pages
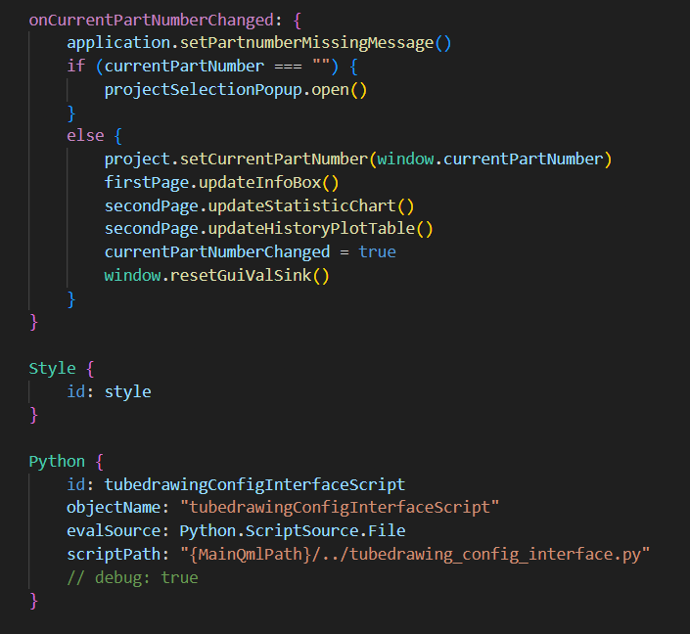
Python and JavaScript to automate the GUI.
Styling is also possible, of course.