Tube drawing operations can benefit greatly from preventing chatter and mitigating the human error in detecting it.
Instead of waiting for the chatter to escalate and potentially damage your workpieces and tools, it’s best to detect chatter in its earliest stages and reduce drawing speed right away.
Cold drawing's inherent problem
Exactly what is chatter, though, and how do you prevent it?
Over the years, cold drawing has become a standard, go-to process for creating precise tube diameters and wall thicknesses. Tubes with larger diameters than the targeted size are drawn through a tapered die to reduce their OD and ID. Besides providing precise geometric results, cold forming increases important material properties such as yield strength, tensile strength, and hardness.
To better control ID quality, a fixed or floating mandrel often is positioned inside the tube, where the tapered die deforms the metal (see Figure 1). A drawing agent is used to facilitate smooth drawing and to improve surface quality.
Often, when the mandrel is pulled into the die, the fixed rod pulls it back before it is pushed back in by the rebound. This mandrel movement leads to strong, audible machine vibrations, sometimes for several seconds—the infamous chatter.
This effect leaves undesirable, periodic ring marks (chatter marks) on the tube’s inner and outer surfaces. Tubes with chatter marks don’t meet geometric specifications, and either the affected section must be cut out or the tube is discarded entirely. On hot summer days, because of changes in the viscosity of the drawing agent, chatter may occur multiple times per hour, leading to process interruptions, high scrap rates, and additional work for machine operators.
Manual chatter attenuation
Not only does chatter increase the amount of scrapped material, but it can cause irreversible damage to the die. In some extreme cases, the mandrel and the tube rip off and become cold-welded to the die by the immense pulling forces.
The extent of the tube damage depends on the intensity and duration of the chatter, so always be ready to slow down the drawing speed as soon as you hear it.
Every time chatter occurs, you’ll need to inspect the product visually for damage. It’s very common to have several feet of defective material even after you slow the machine. It may be tempting to run the entire process at a significantly lower drawing speed to prevent chatter altogether, but this increases production time, lowers machine utilization, and potentially cuts into the company’s bottom line.
What to do about it?
One way to detect chatter before it does lasting damage to tubing is with a high-speed vibration analysis system. It analyzes high-frequency data in real time and translates the results into a speed-reduction recommendation for the drawing machine.
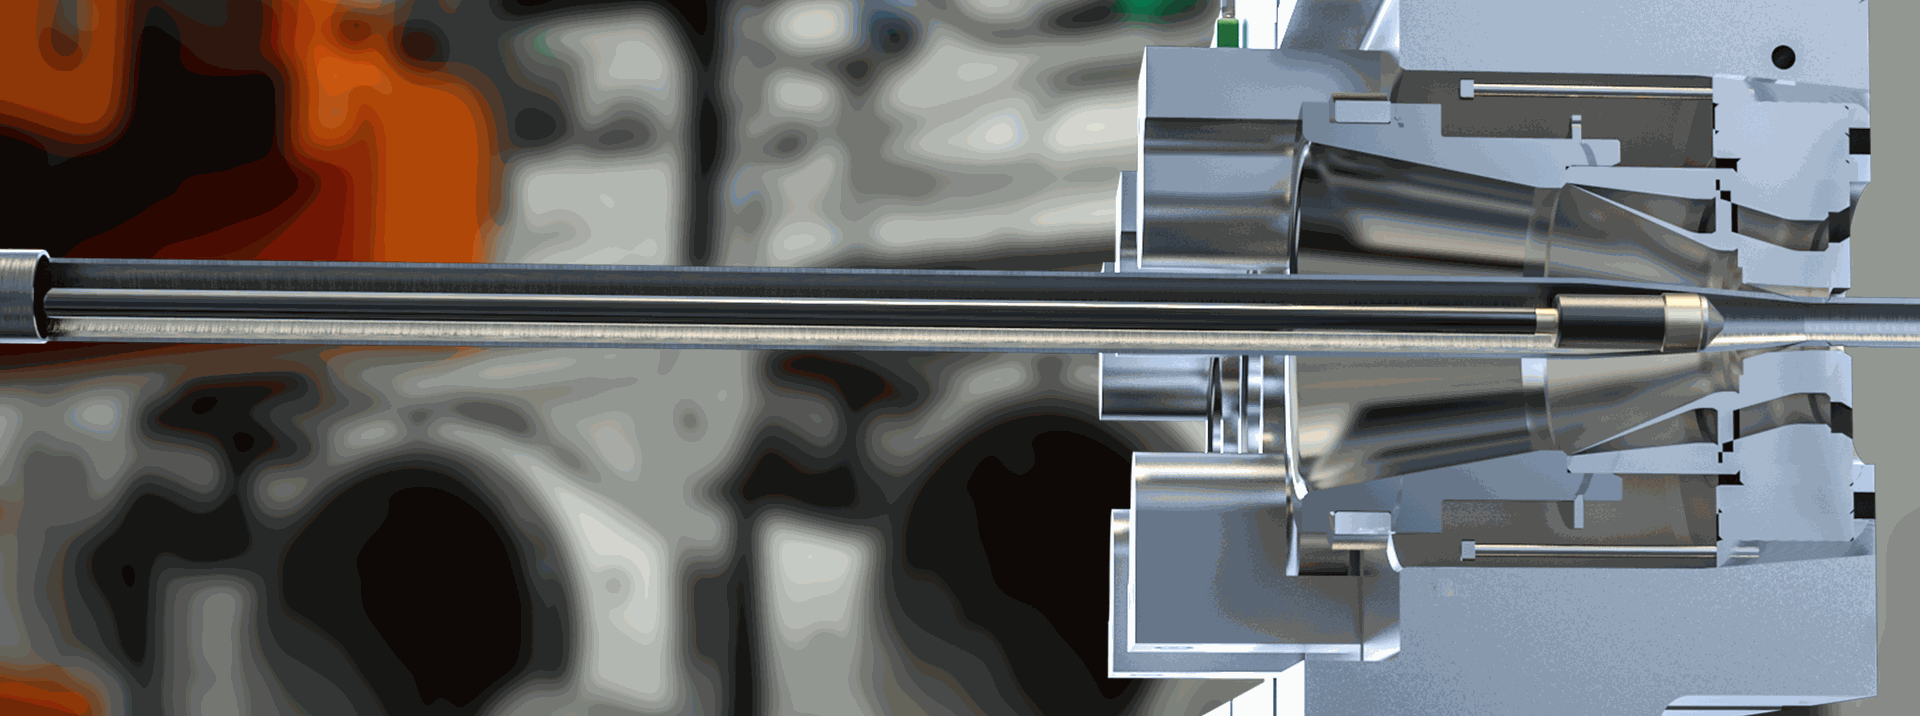
FIGURE 1. This is a cross-section of a drawing die equipped with a fixed mandrel. The tube enters on the left and exits on the right with a narrower diameter.
In this type of measurement system, piezoelectric sensors record ultrasonic, body-borne sound. Ideally, a sensor should be mounted close to the signal source for a better signal-to-noise ratio and so that it does not have to be moved in case of changes to the machine setup. In practice, sensors often are placed on a die stand above the lock ring.
Analog or digital PLCs trigger the start and end of the data analysis. During drawing time, the sensor output is sampled at a rate of 400 to 800 kHz, depending on the acoustic makeup of the process. The data is then transformed into a spectrogram (time x frequency x amplitude) to better separate noise from chatter signals.
Chatter does not occur instantaneously. Rather, its intensity usually increases measurably over several hundred milliseconds. In the spectrogram, chatter initially shows as faint, broadband waves spanning across a wide range of recorded frequencies, regularly spaced across time (see Figure 2). Chatter intensity often increases rapidly until it becomes audible and leaves irreversible marks on the tube.
Algorithms can be designed to detect the warning signs that precede chatter. Since data is translated to a spectrogram, you can focus your analysis on the frequencies in which the signal-to-noise ratio is favorable.
In Figure 2, the chatter-detection algorithm is tuned to frequencies above 150 kHz. The algorithm counts the number of chatter events in the recorded chatter spectrogram. The more events satisfy the carefully defined detection limits, the higher the count. At some point, it exceeds a threshold—200 to 300 milliseconds may pass after the initial chatter detection but before the effect becomes noticeable—and that is when the drawing machine receives the call to slow down.
This slowdown can be achieved either by a stepwise reduction—slowing down to a targeted speed as quickly as possible—or by a gradual reduction that depends on the chatter intensity (mainly because more chatter leads to greater speed reductions). In practice, reducing the speed by 10% to 25% within 1/2 second has shown effective chatter-attenuating results (see Figure 3). After chatter disappears, the reduced drawing speed will be held for a few more seconds before the machine returns to its previous speed.
Benefits of automated chatter monitoring
Vibration-based chatter detection, in combination with predictive machine speed control, can offer a multitude of advantages:
- With optimal sensor placement, early signs of chatter can be detected and addressed before it leaves permanent marks on your product and damages tools. In combination with other best practices in tube manufacturing, the system can help you avoid chatter entirely.
- Since the chatter-detection system intervenes only when necessary, you can operate your drawing machines at significantly higher speeds. The chatter detection system only intervenes when necessary. In practice, machines consistently run at 90% to 95% of their maximum drawing speed after being fitted with the device. Subsequent machine data analysis has shown that this leads to an average of 10% to 15% more machine use.
- Scrap removal often is eliminated, so you can focus on all the other tasks to keep the drawing machine running. While not every operation will experience the same benefits, some have seen marked improvement. “We reduced the scrap from the cold drawing process significantly,” said one former tube company representative who has used the system. “We reduced the scrap by 98%, and at the same time, we could increase the performance by 28%.”
- You can gain insights into the frequency and intensity of chatter and use this data to improve preceding manufacturing processes, including the application of drawing agents and the idle time of lubricated tubes.
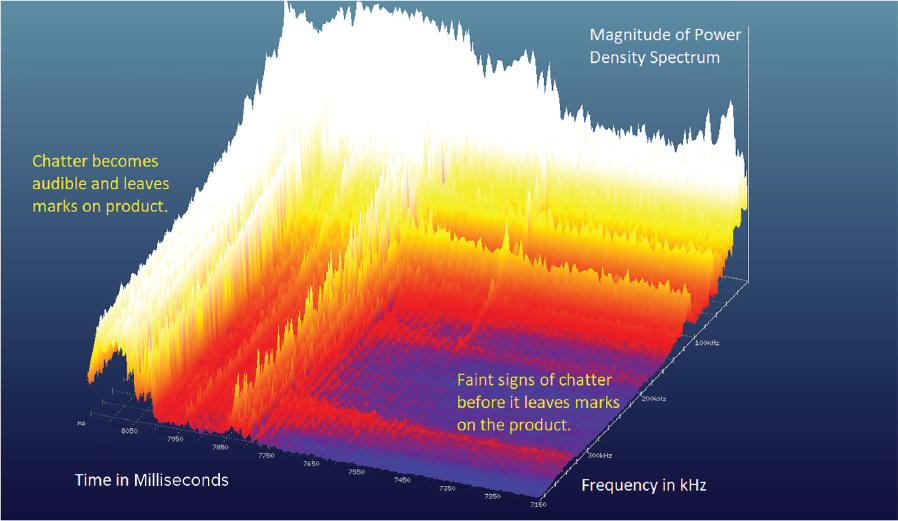
FIGURE 2. This spectrogram shows typical chatter (350 milliseconds long, maximum frequency of 400 kHz). Below frequencies of 150 kHz, machine and process noise superimpose the chatter signal. In the first half, chatter shows regularly spaced, broadband signals with increasing magnitude over time. This is where chatter can still be attenuated without it leaving visible marks on the product.
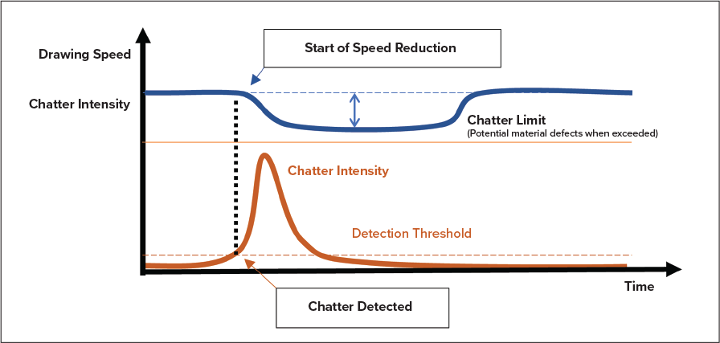
FIGURE 3. The detection algorithm determines the chatter intensity (orange curve). When it exceeds the detection threshold, the drawing machine is asked to slow down the drawing speed.