Structure-borne sound measurement HFIM
How we make your processes measurable and visible
Unique feature: What is it that only QASS can do?
Conventional acoustic analysis devices examine the vibrations of an object. Optimizer4D goes one important step further and finds the impulses that trigger the vibrations. Consequentially the user gains an additional value: An industrial production process causes a lot of noise at the same time, many structure-borne sound signals. These superimpose into squeaking, chattering, etc. Optimizer4D detects the real source of every sound, because it uses a high sampling rate, frequency analysis, and pattern recognition.
This evaluation is based on the unique selling points of Optimizer4D:
- 50 Mio. samples per second
- Spectral analysis of the signals in real time
- Cognitive Big-Data-Analysis, consisting of a selective frequency filter, pattern recognition, and other software tools
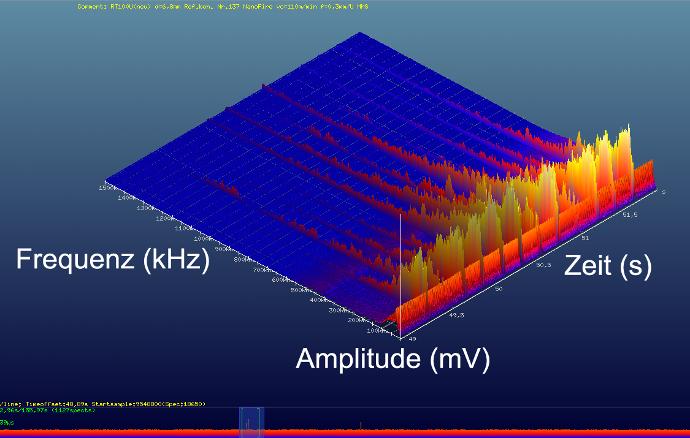 QASS Optimizer4D displays the structure-borne sound signals in three dimensions – using the axis for time, frequency and amplitude. Thus, different processes in machine and component show their unique fingerprint.
The path of the signal
HFIM, High-Frequency-Impulse-Measuring, consists of a far-reaching analysis of structure-borne sound. Machine and product emit signals when working.
Optimizer4D takes those signals using piezo sensors and converts them into a three dimensional image of the process by Fourier transformation.
Cognitive analysis algorithms determine the condition of tool, machine and product. Then, it can send back control data to the machine (e. g. Profibus/ IO-digital, Profibus, Profinet, SPC…).
The video shows a simple demonstration of the operating mode of Optimizer4D: A table tennis ball is making noise on a steel plate. Optimizer4D detects these signals and depicts them on a three dimensional diagram on the axis for time, frequency and amplitude. Live, in real-time and non-destructive.
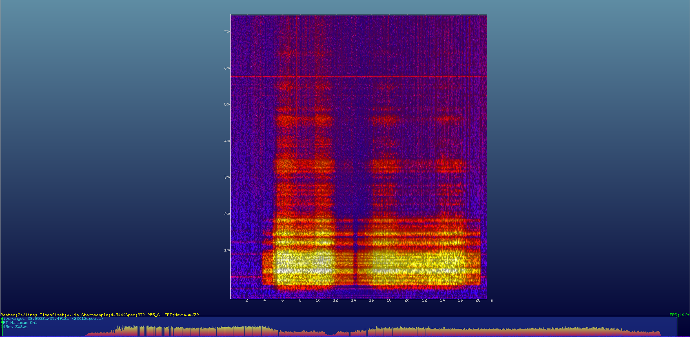
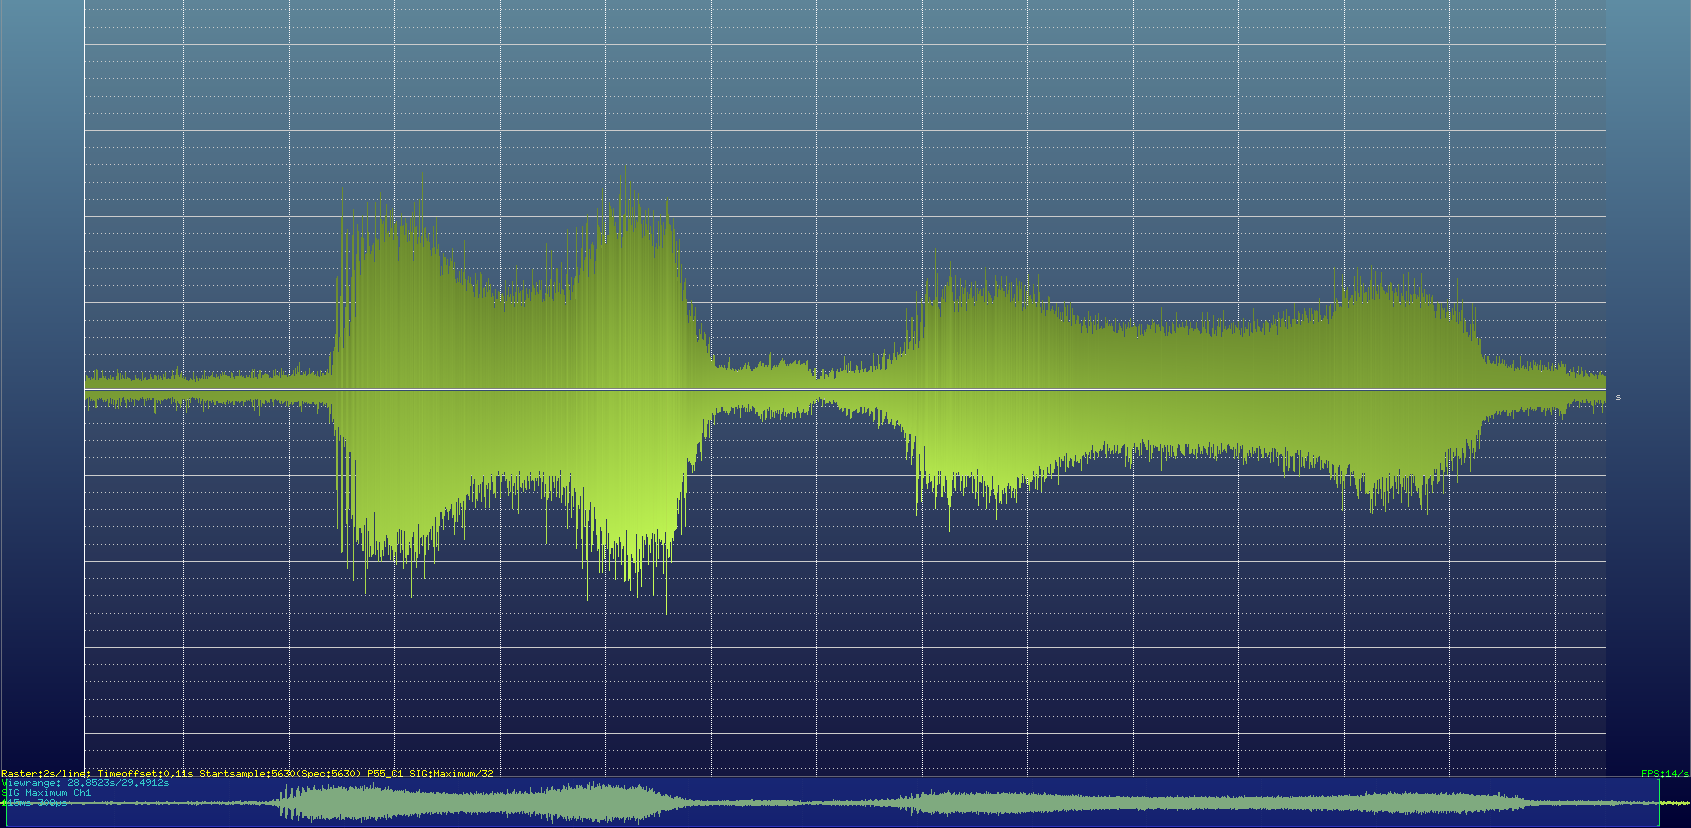 Acoustic emission signals in a conventional diagram with the axes amplitude and time.
 Three dimensional diagram of acoustic emission, made possible by a spectral analysis. The source is the same as in the two-dimensional image to the left.
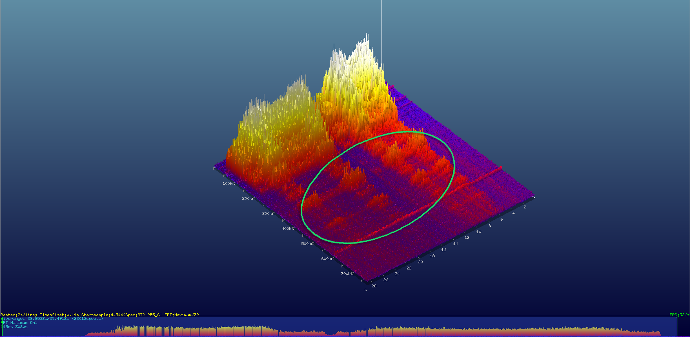
Both diagrams show the same structure-borne sound signal, one in a conventional two-dimensional image and one in the 3D process landscape of the spectral analysis. In the 3D image you can clearly distinguish the signal from the noise (as seen in the area marked green). The two-dimensional image will hide the important signal, because it cannot show signals that are being overlapped.
 View on the diagram showing the axes time and amplitude.
 View on the diagram showing the axes frequency and time.
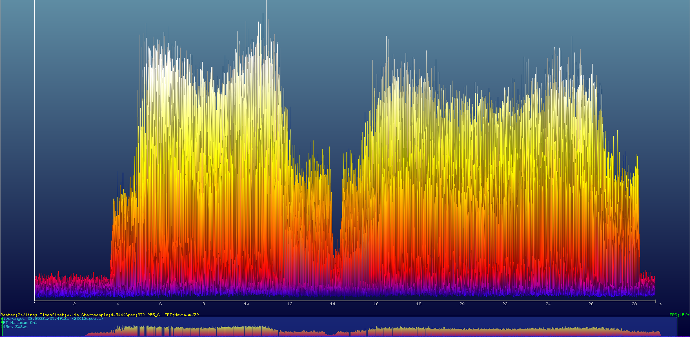
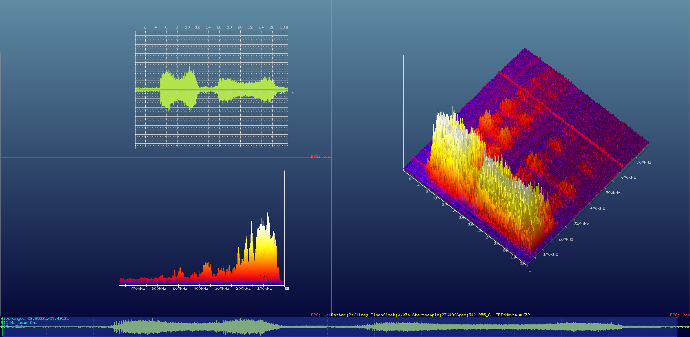 Multiple viewpoints of the same signal: Time and amplitude (upper left); frequency and amplitude (lower left); time, frequency and amplitude (right).
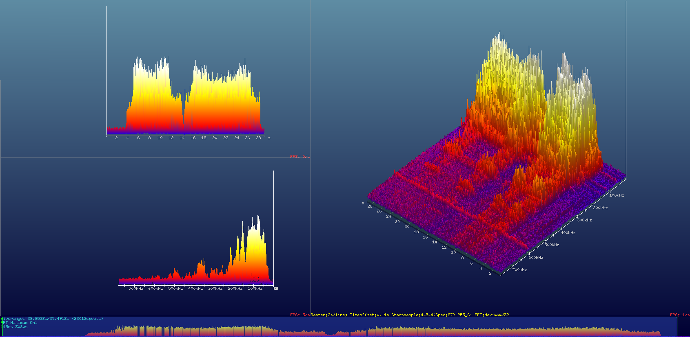 The same signal shown in three different illustration styles – only Optimizer4D made by QASS is able to do this kind of spectral analysis of acoustic emission
Details
The fourth industrial revolution, often in connection with keywords like “Smart Factory” or “Internet of Things”, makes great demands on modern manufacturing plants.
On the one hand plenty of data from the production become directly accessible and therefore open the door for faster, better, and more affordable production processes. On the other hand this volume of data requires completely new analysis algorithms and handling strategies to tap the full potential. Hence, it is by no means enough to just measure the data and file it.
Cognitive Measuring
The real challenge starts afterwards. It lies in the processing and interpretation of this data to gain useful information and make concrete decisions. This is what QASS calls “cognitive measuring technique”: informative interpretation of measuring data while they are still being collected.
The technology to master this challenging task is the patented high-frequency-impulse-measurement (HFIM). It is a specific method of acoustic emission analysis. It performs a frequency analysis of the recorded sound amlitudes during the measuring, usually via fast Fourier transformation. With this method you are gathering information in-process not only about the sound level of the process you are measuring, but also about the frequency distribution.
Easy distinction between interference and signal
This enables the easy distinction between interfering signals (e. g. machine noise) and process relevant signals (e. g. crack occurrences or tool wearout), even if those are considerably weaker than the interfering signals. In-line quality control, predictive maintenance and process documentation – the HFIM technology is available for various industrial production processes.